Oracle Virtual Desktop Infrastructure (VDI) is a virtualization technology for deploying and managing server-hosted desktop operating systems that users can access from a wide range of client devices. Oracle VDI provides centralized system administration, flexibility in the choice of desktop operating systems and virtualization platforms, and high availability of desktop systems. With the Enterprise Manager Plug-in for Oracle VDI, the entire installation can be monitored from a central management console.
The Enterprise Manager Plug-in for Oracle VDI adds support for monitoring Oracle VDI resources, which include the Oracle VDI Center and its hosts, companies, desktop pools, desktop providers, hypervisor hosts and storage. These resources are called targets in Oracle Enterprise Manager. Multiple Oracle VDI Centers can be added and monitored through the plug-in. The Oracle Enterprise Manager Monitoring Agent periodically retrieves metrics and configuration data to display them on the monitoring page of each target. In addition to the information retrieved at regular intervals, the target pages also contain a number of graphs with historical data, showing the evolution of certain metrics over time.
For the most detailed information, the menu on the monitoring target pages provides access to the raw metric data as collected by the Monitoring Agent. On the built-in Oracle Enterprise Manager All Metrics page, you can access all metric values collected for each target, as well as real-time values.
The Enterprise Manager Plug-in for Oracle VDI only adds monitoring capability. It does not allow Oracle VDI resources to be managed directly from within Oracle Enterprise Manager.
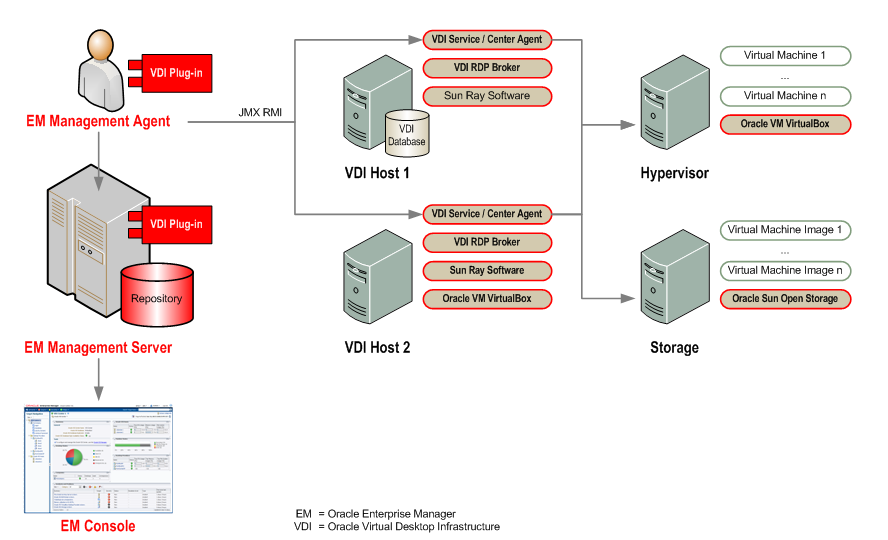
When the Enterprise Manager Plug-in for Oracle VDI is installed and deployed, the Management Agent establishes a secure communication channel to an Oracle VDI Center Agent. It retrieves metric and configuration data through the Oracle VDI Center Agent.
This architecture simplifies the Oracle Enterprise Manager setup. No configuration changes are required on any Oracle VDI host. The Management Agent may run on a host that is not part of the Oracle VDI environment. For example, it could run on the Oracle Enterprise Manager host itself. A single Management Agent is sufficient to monitor an entire Oracle VDI installation.
To configure an Oracle VDI Center target, you provide the fully qualified domain name of an Oracle VDI Center host and the login credentials of an Oracle VDI administrator account. With this information, the Management Agent connects to the Oracle VDI Center Agent. It reads the configuration of the entire Oracle VDI Center and automatically creates monitoring targets in Oracle Enterprise Manager for each component.
Because the majority of the monitoring information is stored in the Oracle VDI database, which is available to all Oracle VDI hosts, the Management Agent communicates almost exclusively with the Oracle VDI Center Agent that it initially connected to. The Oracle VDI host running this agent is called the preferred host. If that agent should become unavailable, the Management Agent automatically falls back to the agent on the next available Oracle VDI host. In normal circumstances, the Management Agent only communicates with other Oracle VDI Center Agents to retrieve information that is not stored in the shared database. For example, to check the status of services running locally on an Oracle VDI host.
The Enterprise Manager Plug-in for Oracle VDI is also deployed on the Oracle Management Server (OMS). At regular intervals, the Management Agent uploads collected data to the OMS, which stores it in the Management Repository. The data is visualized on the Oracle VDI target pages in the Oracle Enterprise Manager Console. Each Oracle VDI component has a corresponding target page, which displays the most recently uploaded data, as well as graphs with historical data showing the evolution of certain metrics over time. For example, the CPU and memory consumption of a desktop provider in the past 24 hours.
Information displayed on the target pages is always retrieved from the Management Repository. There is no communication with the Management Agent when the monitoring data is loaded. For real-time values, use the target's menu to display the All Metrics page. It shows raw metric data as collected by the Management Agent, and the time when the data was last uploaded to the OMS. If you select a metric, its values are retrieved in real-time from the Management Agent (unless otherwise noted on the page).
The default collection interval for Oracle VDI metrics is 15 minutes. Critical metrics, such as the status of services (up or down), are collected every 5 minutes. Configuration data and other values that do not change frequently are collected every 24 hours. The Oracle Enterprise Manager Console allows the user to change the collection interval for each target metric individually. For instructions to customize the collection schedule, see "Collection Intervals" in Section 4.3, “Metrics Collection”.
Monitoring metrics over time allows you to identify potential bottlenecks and take preventive or corrective actions. Critical failures may also occur, and require immediate attention. Oracle Enterprise Manager supports the concept of events. An event is a significant occurrence outside normal operating conditions on a managed target. For example, events are automatically triggered when an Oracle VDI component, such as a single host or an essential service, is detected as being down.
For all metrics a threshold can be defined. Crossing a threshold triggers a corresponding event. Each event is associated with a severity level: fatal, critical, warning or clear. Examples of events include very high CPU utilization on a particular host, and a large number of unresponsive desktops in a pool. The Enterprise Manager Plug-in for Oracle VDI includes predefined thresholds for the many of the collected metrics. These defaults can be changed as required for every metric.