1 Overview of Oracle Business Transaction Management
This chapter introduces Business Transaction Management. It describes the following:
-
Business Transaction Management Architectural Overview
If you are upgrading from an earlier version, please see Section 1.4, "Functional Upgrade Issues," for more information.
1.1 Using Business Transaction Management
Using Business Transaction Management, a component of the Oracle Management packs, you can do the following:
-
discover the services deployed in your application environment and understand how they work together
For a complete and up-to-date list of the types of services and components that Business Transaction Management can discover and monitor, refer to the Business Transaction Management Certification Matrix. You can locate this document by searching for ”BTM certification” at
http://support.oracle.com. -
define and track transactions, and understand the business context of each transaction, including the transaction's consumers and business payload
-
monitor the performance of services and transactions in real time
-
define service-level agreements to set performance targets based on business criteria and to monitor performance relative to those targets
-
generate alerts that warn you of unusual conditions
-
monitor failures and perform root-cause analysis to locate bottlenecks, errors, and incomplete transactions
For a discussion of the workflow involved in working with Business Transaction Management, see Chapter 2, "Getting Started with Business Transaction Management."
You access the Business Transaction Management feature set by way of the Management Console. For information about using the console, read Chapter 3, "Using the Management Console."
You can also use a command line interface (CLI) to execute scripts and individual commands. For information about using the CLI, see Chapter 10, "Commands and Scripts."
It is also possible to access some Business Transaction Management functionality from the Enterprise Manager console. See "New Features and Changes" for more information.
1.2 New Features and Changes
This section describes the new features added and the changes made since the last release.
-
SOA_B2B probe – Monitors SOA B2B (Business to business) adapters of SOA applications.
-
Out of band discovery - enables dynamic discovery period for when an observer attempts to discover new components. For more information on this feature, enabled in the advanced settings for observers, see Section 12.1.2.11, "Advanced Settings Field Reference."
-
SOA 12.1.3 - Business Transaction Management is now compatible with Oracle SOA Suite Release 12.1.3.
-
SOA_REST adapter -Monitors SOA REST adapters of SOA applications (SOA Release 12.1.3 only)
-
OSB 12c - Business Transaction Management is now compatible with Oracle Service Bus Release 12c. Install the WebLogic 12 observer to use this feature.
For a complete and up-to-date list of the types of services and components that Business Transaction Management can discover and monitor, refer to the Business Transaction Management Certification Matrix. You can locate this document by searching for ”BTM certification” at http://support.oracle.com.
1.3 Architectural Overview
At the highest level, Business Transaction Management consists of three types of components:
-
Central servers – The central servers are application EAR files that you deploy to an application server. There are three central servers. You deploy only one instance of each of these servers, and for performance considerations you should deploy each to a separate application server. You must not deploy any of the central servers to an application server that hosts services or components you intend to monitor. The central servers are as follows:
-
Main Server (btmMain.ear) – Contains all the central Business Transaction Management system services and user interface applications, including the sphere. The sphere is the Business Transaction Management component that manages the Business Transaction Management environment. In addition, btmMain.ear contains a subdeployment for the F5 intermediary.
-
Performance Server (btmPerformanceServer.ear) – Contains the service-level management components. Deploy btmPerformanceServer.ear on an application server other than where btmMain.ear or btmTransactionServer.ear are deployed.
-
Transaction Server (btmTransactionServer.ear) – Contains the transaction management components. Deploy btmTransactionServer.ear on an application server other than where btmMain.ear or btmPerformanceServer.ear are deployed.
-
-
Observers – Observers are sets of libraries that you install into the application server that hosts the business applications you want to monitor. The observers monitor messages and calls between the components of your applications. Observers are capable of monitoring many types of components, and are classified according to the type that they monitor, for example, JavaEE, OSB, WCF, etc.
-
Monitors (btmMonitor.ear) – Monitors collect application performance and usage measurements from observers. The monitor is an application EAR file that you deploy to an application server. For large systems, you can deploy multiple monitors, either as singletons or replicates. For performance reasons, you should not deploy the monitor on an application server where the central servers are deployed.
Business Transaction Management also requires access to an Oracle RDBMS for storing performance measurements, logging messages, and maintaining the environment model and Business Transaction Management configuration.
The diagram below shows a typical distributed application environment, and the relationship of the Business Transaction Management components to that environment.
Figure 1-1 Deployment of Business Transaction Management components in a typical application environment
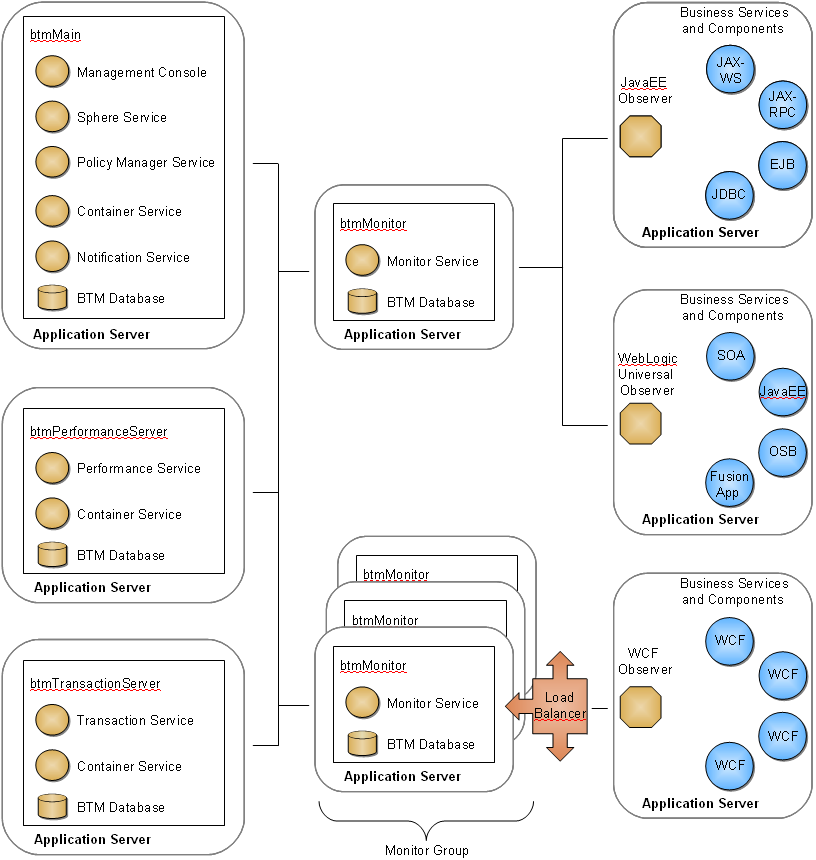
Description of "Figure 1-1 Deployment of Business Transaction Management components in a typical application environment"
Business Transaction Management is designed for use in a distributed application environment in which the various Business Transaction Management components are deployed onto multiple machines and application servers.
Technically, you can install all the central servers into a single application server, but such a deployment scenario is not recommended for production environments. Installation in a single application server can be useful for demonstrations and for learning how to use the product, but this scenario might not scale successfully with a large number of business services or high volume of message traffic, just to name a few factors.
We recommend that you deploy each of the central servers to separate application servers. The Performance and Transaction components, in particular, typically perform a large amount of performance analysis computations. Dividing processes across application servers allows you to control memory and processor resources.
You should also deploy the monitor to an application server separate from the central servers. Depending on your monitoring requirements, you might need to deploy multiple monitors. You can deploy monitors either as singletons or as replicates behind a load balancer. For information about replicating the monitor, refer to the Business Transaction Management Installation Guide.
Observers must always be installed outside the application server hosting the central servers or monitors.
1.4 Functional Upgrade Issues
Business Transaction Management aims to provide the simplest process possible for upgrading from the 12.1.0.2, 12.1.0.3, 12.1.0.4, or 12.1.0.5 release.
The upgrade process seeks to minimize downtime while preserving management configurations, object definitions, and existing operational data.
For a detailed description of the process used to back up and upgrade your system, please consult the Business Transaction Management Installation Guide.
This section describes the changes introduced in this upgrade that might affect the ability of Business Transaction Management to monitor your transactions and to secure communications. You should read through these sections to make sure you understand how changes to the product might affect your transaction definitions and the ability of Business Transaction Management to observe and monitor your transactions. After you upgrade, we recommend that you run some traffic and audit your transaction instances to make sure the system is observing and monitoring your transactions as you expect it to. If it is not, you might need to adjust observer communication policies, update transaction definitions, or add manual keying between nodes as appropriate to your situation.
If, after reading through the following subsections, you are still unclear about the implications of upgrading to the 12.1.0.5 release, please open a service request with Oracle Technical Support.
1.4.1 Effect of Universal Observer for WebLogic 10.3 Servers
In releases previous to 12.1.0.3, a variety of observers were provided for installing into WebLogic 10.3 servers. Each type of observer contained a set of probes that gave it the ability to monitor a particular set of component types. For example, the JavaEE observer contained probes for monitoring JavaEE components and the SOA observer contained probes for monitoring SOA components. Starting with release 12.1.0.3, only a single ”universal” observer is provided for installing into WebLogic 10.3 servers. This universal observer contains a superset of all the probes contained in the older observers, making it capable of monitoring the superset of component types that were previously monitorable.
After you upgrade to the universal observer, your system will have the ability to discover and monitor new types of components. This enhanced capability might result in the discovery of new objects and could impact your ability to view and monitor transactions as explained below.
If you have a transaction A -> B -> C, and the newly observed operation is B1 (the resulting call chain is A -> B -> B1 -> C), two outcomes are possible, depending on the means of correlation used:
-
Auto-correlation: Operation C will be shown in gray. If there is a missing message condition defined from B to C, you will be alerted. You will need to redefine the transaction to make C visible and to have the transaction be monitored. In those rare cases where the message from A to B to C does not change, the system will continue to observe and monitor C.
-
Manual-correlation: Operation C will be visible and correlated to B. The newly observed operation B1 will be visible in the dependency graph, but not in the transaction definition. You will need to redefine the transaction to make B1 visible. In this case, the transaction will be monitored, but B1 will not be included in it.
During the upgrade process, the values in existing observer communication policies are carried forward. This means that if an existing policy has most of its probe fields activated and you upgrade to the WebLogic universal observer and the application server hosts component types that weren't discovered before but are of a type for which there is now an activated probe, then these will be discovered and monitored.
To limit the number of components discovered and monitored to those of interest, before upgrading, you might want to review and adjust the active probes in your observer communication policy. To check your work and determine the changes introduced by the use of the universal observer, you should audit all transactions that contain operations running on WebLogic 10.3 containers.
Information about observers is provided in Section 12.1.1, "About Observers." Instructions for upgrading observers are provided in the Business Transaction Management Installation Guide.
1.4.2 Effect of New Default Setting for Limiting Discovery
Depending on the underlying technology, some messages flow directly from a client to a service endpoint; others flow through a host of intermediate endpoints before they reach their actual destination. Such intermediate endpoints might comprise the implementation of a messaging system, a job scheduling system, a distributed system, and so on.
When installing probes for technologies that use intermediate endpoints, Business Transaction Management allows you to specify whether you want to monitor all endpoints or just the endpoints at the edge of such systems; often these are the endpoints that directly represent the business services of interest. In the current release, by default, the monitoring of intermediary endpoints is turned off. This improves monitoring performance and eliminates data that is not essential to monitoring your distributed applications.
If you are upgrading from a system where the monitoring of intermediate endpoints was turned on, Business Transaction Management retains the knowledge of these endpoints after upgrading to the new default setting. You will be able to see these endpoints in the dependency graphs; they will be grayed out in the transaction graphs. You can edit your transaction definitions to remove these endpoints.
As the default setting implies, we recommend turning off the monitoring of intermediate endpoints.
For more information on limiting discovery, see Section 4.1.3, "Limiting Discovery."
1.4.3 Effect of New Authentication Settings
The current release of Business Transaction Management introduces observer authentication and sets SSL on by default for communication between observer and monitor. These features are described in the Business Transaction Management Installation Guide. In the current release, if you create a new observer communication policy, client authentication and SSL is on by default.
Upgrading your system should not affect expected behavior in most cases. Combining old observers with new communication policies is the one case that will affect communication between observers and monitors as explained below.
-
An existing observer is communicating with a monitor that was not using SSL. When you upgrade, nothing changes. The new observers will behave like the old observers. To change behavior, edit the observer communication policy to add SSL or observer authentication.
-
An existing observer is communicating with a monitor over SSL. When you upgrade, this will continue to work the same way. If you wish to add client authentication, you must edit the observer communication policy to do so.
-
You have an old observer in the field, and you upgrade the central server and monitors. If you then create a new observer communication policy that applies to the old observer, the old observer will fail because it will not be able to authenticate to the monitor, and the monitor will not be able to recognize anything the old observer is sending to it. If a new observer is available and you want to use client authentication, install the new observer. If a new observer is not available, turn off authentication in the observer communication policy.
1.4.4 Effect of New Probes
The release 12.1.0.6 universal observer for WebLogic 10.3 provides these new probes:
-
SOA_B2B – Monitors SOA B2B (Business to business) adapters of SOA applications.
The release 12.1.0.5 universal observer for WebLogic 10.3 provides these new probes:
-
SOA_JCA – Monitors SOA JCA adapters including AQ, Database, File, FTP, JMS, MQ Series, Socket, and Oracle Applications.
The release 12.1.0.4 universal observer for WebLogic 10.3 provides these new probes:
-
SOA_WORKFLOW – Monitors Oracle SOA Human Workflow components and notifications.
-
SOA_DIRECT – Monitors direct binding calls between SOA composites and between SOA and Oracle Service Bus.
After upgrading to an observer that contains new probes, the probes are immediately available in all new Observer Communication policies that you create. However, the probes are not automatically added to your existing policies. If you want to use one of the new probes in an existing policy, you must manually add it to the policy. For information on how to add a probe to a policy, see Section 12.1.2.3, "Adding Probes."
Once activated, the new probe types will discover new types of components. If any of these newly discovered components are called within the flow of a transaction that you have defined, then complete monitoring of the transaction will no longer be possible. Monitoring of the transaction will end at the newly discovered component.
In order to monitor the complete transaction, you must edit the transaction in one of this ways:
-
Return the transaction to its original state by manually keying the disjoined nodes back together.
-
Enlarge the transaction by adding the newly discovered component as a new node in the transaction and then connecting it to the disjoined nodes.
1.4.5 Effect of New JMS Option in the Model Configuration Settings
Upgrading your central servers and monitors adds a new JMS option to the Model Configuration section of the Advanced Settings for all new Observer Communication policies that you create (existing policies are not affected). By default, this new JMS option is set to Model Edge of Flow. At this setting, only JMS topic message listeners are modeled. If you want to model all JMS topics, JMS queues, and their associated message listeners, then you must edit the JMS option and set it to Model All.
For more information, see the Model Configuration entry
1.4.6 Effect of Improved JMS Probe
Release 12.1.0.4 provides a new and significantly improved JMS probe for WebLogic that replaces the JMS probe found in earlier releases. The new JMS probe is contained in these observers:
-
Universal Observer for WebLogic 10.3
-
JavaEE Observer for WebLogic 12.1
After you upgrade the central servers and monitors, they will be compatible with both the new and old JMS probes. You are not required to upgrade your observers, and, if you don't, they will continue to perform as before. You are also permitted to run a mixed system in which some of your observers are upgraded and some are not. However, we highly recommend that you upgrade all of your observers.
Once upgraded, your observers will rediscover the JMS components in your system and model them as new types of JMS services. Queues and topics are modeled as services of type JMS Resource, and message listeners are modeled as services of type Message Listener. Your old JMS services (discovered by the old JMS probe) will continue to be displayed but will not register business traffic flowing through the system. These old services are of type JMS Message Consumer. You should unregister these old JMS services.
Transactions that include any of the old JMS services will cease to function correctly. You should delete these old transactions and redefine them using the newly discovered JMS services.