1 Installing and Using the Oracle Enterprise Manager Plug-in for OUD
The Enterprise Manager Plug-in for Oracle Unified Directory extends Oracle Enterprise Manager Cloud Control 12 c to add support for monitoring Oracle Unified Directory(OUD) instances.
This chapter contains the following sections:
1.1 Before You Install
OUD can function in one of the following three modes:
-
As an LDAP directory server instance, used to contain data
-
As an LDAP proxy server instance, where the server acts as an interface between the client and the directory server or servers that contain the data
-
As a replication gateway instance between OUD and Oracle Directory Server Enterprise Edition (ODSEE)
The Enterprise Manager Plug-in for OUD is provided as an archive that includes three target types, one for each OUD installation mode or type. (See "Deploying the Plug-in" for download information.) Install the plug-in that corresponds to the type of OUD instance that you want to monitor.
1.1.1 Release Information
This 12.1.0.2 version of the Enterprise Manager Plug-in for OUD enables you to monitor the following:
-
Oracle Unified Directory 11.1.2.2.0 and later for Directory target instances
-
Oracle Unified Directory 11.1.2.2.0 and later for Proxy target instances
-
Oracle Unified Directory 11.1.2.2.0 and later for Replication Gateway target instances
Version 11g Release 2 (11.1.2.1.0) of the Enterprise Manager Plug-in for OUD, formerly named the Oracle System Monitoring Plug-in for OUD for Enterprise Manager 11g Grid Control, is available at http://www.oracle.com/technetwork/oem/downloads/unified-directory-514420.html.
1.1.2 Installation Prerequisites
-
See the Enterprise Manager Plug-In for Oracle Unified Directory Certification Matrix available on
My Oracle Support.The certification matrix contains information about supported installation types, platforms, operating systems, databases, JDKs, and third-party products.
-
Install Enterprise Manager Cloud Control 12c (12.1.0.4) or later with the latest bundle patch. Be sure Oracle Management Service and the Oracle Management Agent are installed. It is recommended that the Oracle Management Agent and the OUD instances be installed on the same host.
For detailed information, see the Enterprise Manager Cloud Control 12c Documentation site
http://docs.oracle.com/cd/E24628_01/index.htm. -
Make sure that the Oracle Management Agent can communicate with your Oracle Enterprise Manager Server and can upload data. For example, Agent Availability must be UP, Last Load Time should show a recent date/timestamp, and Last Load Time should be Periodically updated. For information about installing and configuring the Oracle Management Agent, see the Oracle® Enterprise Manager Basic Installation Guide.
1.2 Deploying the Enterprise Manager Plug-in for OUD
This section provides the major steps required to deploy the plug-in. For many of the steps, you will be directed to use the instructions already provided in the Oracle Enterprise Manager Cloud Control Administrator's Guide http://docs.oracle.com/cd/E24628_01/doc.121/e24473/toc.htm.
To deploy the Plug-in for OUD:
-
Import the plug-in.
See Section 1.2.1, "Importing the Plug-in Archive." -
Deploy the plug-in.
See Section 1.2.3, "Deploying the Plug-in.". -
Create a target instance of the plug-in on the Oracle Management Agent.
See Section 1.2.4, "Adding Targets To Monitor".
1.2.1 Importing the Plug-in Archive
For detailed instructions, see the "Downloading Plug-ins" chapter in the Enterprise Manager Cloud Control Administrators Guide: http://docs.oracle.com/cd/E24628_01/doc.121/e24473/plugin_mngr.htm#CJGBEAHJ
1.2.2 Upgrading the Plug-In
For detailed instructions to upgrade plugin version 12.1.0.1.0 to 12.1.0.2.0, see the sections "Upgrading Plug-Ins Deployed to Oracle Management Service" and "Upgrading Plug-Ins Deployed to Oracle Management Agent" in the Oracle Enterprise Manager Cloud Control Administrator's Guide.
1.2.3 Deploying the Plug-in
Deploy the plug-in on the Oracle Unified Directory instances to be monitored. For detailed instructions, see "Deploying Plug-ins to Oracle Management Service" in the Enterprise Manager Cloud Control Administrators Guide: http://docs.oracle.com/cd/E24628_01/doc.121/e24473/plugin_mngr.htm#CJGCDHFG
You can now create a target instance.
1.2.4 Adding Targets To Monitor
Create a target instance of the Enterprise Manager Plug-in for OUD on one or more agents. You must create one target instance for each OUD instance.
-
On the Setup Menu, choose Add Target > Add Targets Manually.
-
On the Add Target page, choose the Add Targets Declaratively by Specifying Target Monitoring ProPerties option.
Choose the Target Type and the list of agents to which you deployed the plug-in.
-
Click Add Manually.
-
On the Add OUD Instance proPerties page, enter the following values:
OUD Credentials
-
In the Directory Server Username and Password fields, enter a username and password that will be used by the agent to bind to the server instance. Ensure the password is in the appropriate field.
ProPerties
-
In the Administration Port field, enter the administration port of the target server instance.
-
In the Directory Server Host field, enter the fully qualified domain name of the target server instance. For replicated servers, you must provide the same host name that was used when replication was configured.
-
The Trust All field is set to true by default. This implies that all the certificates that are presented by the server (or servers, in the case of replication) will be accepted automatically. Change this setting if you want to specify different behavior.
-
(Optional) If you have changed the default setting for the Trust All field, enter a path in the Trust Store Path field.
The agent will use the trust store located in this path to validate the certificates of the administration connector that are presented by the server(s). This path must be readable by the agent (and thus located in a file system that is accessible by the agent). The trust store must contain the public keys of the administration connector certificates. It must be in JKS format and must not be password protected.
-
-
Click OK.
1.3 Viewing Performance Metrics for an OUD Instance
This section contains the following topics:
-
Section 1.3.4, "Summary of Directory Server Instance Monitoring Information"
-
Section 1.3.5, "Summary of Proxy Server Instance Monitoring Information"
-
Section 1.3.6, "Summary of Replication Gateway Monitoring Information"
1.3.1 Viewing an OUD Instance Home Page
The Enterprise Manager Plug-in for Oracle Unified Directory collects and displays information and Performance metrics for a Oracle Unified Directory instance.
To navigate to an OUD instance Home page:
-
On the Oracle Enterprise Manager home page, select Targets.
The Hosts page is displayed.
-
Click All Targets in the top menu bar.
-
Choose the OUD target instance name.
The target instance Home page is displayed.
The monitoring information displayed in the Enterprise Manager Cloud Control console depends upon the current Oracle Unified Directory instance type: Directory Server instance, Proxy Server instance, or Replication Gateway instance. Table 1-1 summarizes the information available for the different OUD instance types.
Table 1-1 Monitoring Data Available Through the Enterprise Manager Plug-in
| Information | Directory | Proxy | Replication GW |
|---|---|---|---|
|
General Information |
Yes |
Yes |
Yes |
|
JVM Resources |
Yes |
Yes |
Yes |
|
Connections |
Yes |
Yes |
- |
|
Administration Connector |
Yes |
Yes |
Yes |
|
Connection Handlers |
Yes |
Yes |
- |
|
Operations |
Yes |
Yes |
Yes |
|
Replication Information |
Yes |
- |
Yes |
|
Backends / Databases |
Yes |
- |
- |
|
Internal Resources / Caches / Workqueues |
Yes |
Yes |
- |
|
Global Index Catalog |
- |
Yes |
- |
|
Distribution / Partitions |
- |
Yes |
- |
|
Data Sources / Connection Pools |
- |
Yes |
- |
Monitoring information is displayed on various pages in the Enterprise Manager Cloud Control console. You can access these pages through the OUD target instance submenu.
Figure 1-1 Comparison of Target Instance Submenus
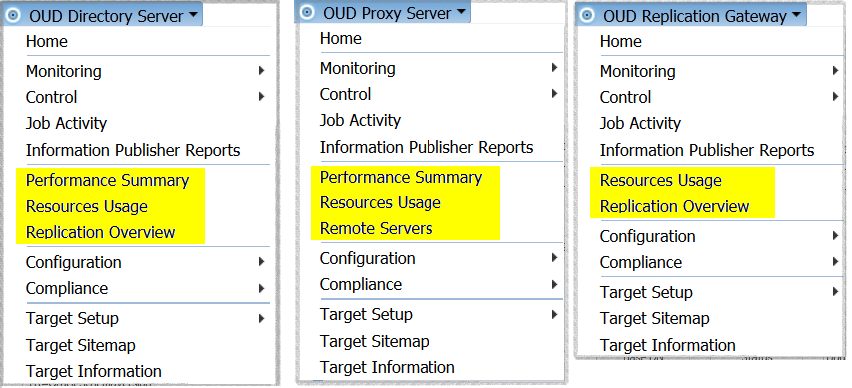
Description of "Figure 1-1 Comparison of Target Instance Submenus"
Table 1-1 compares submenus for an OUD Directory Server instance, OUD Proxy Server instance, and OUD Replication Gateway instance. All submenus include many identical commands including: Home, Monitoring, Control >, Job Activity, Information Publisher Reports, Configuration >, Compliance >, Target Setup >, Target Sitemap, and Target Information. For each target instance, however, the Home page presents different high-level information based on the target instance type.
In Table 1-1, the following differences are highlighted:
-
For a Directory Server instance, the submenu provides access to the following information: Performance Summary, Resources Usage, and Replication Overview.
-
For a Proxy Server instance, the submenu provides access to the following information: Performance Summary, Resources Usage, and Remote Servers.
-
For a Replication Gateway instance, the submenu provides access to the following information: Resources Usage and Replication Overview.
For all target types, the Monitoring > All Metrics command provides access to a complete list of the monitored metrics for the target instance. The information displayed is determined by the Oracle Unified Directory instance type.
Performance information is provided in terms of averages and rates, depending on the information type. Data is represented in both text and graphical form.
Numerical information and comparative data indicates the most recent sampled data. By default, the Oracle Management Agent gathers a new sample of data every five minutes. Line graphs are constructed by point, with each point representing a collected data.
Alerts are generated, based on specific thresholds that you can configure on the Monitoring > Metrics and Collection Settings page.
1.3.2 Using the All Metrics Page
The Oracle Unified Directory submenu pages display only a subset of the monitored metrics. The Monitoring > All Metrics command provides access to all the monitored metrics for the target instance.
For example, the Performance Summary page of a directory server page provides information on the about the add, delete, modify, modify DN, search, and bind Operations Performed on the server. The All metrics page also provides Operations information for each LDAP connection handlers, which are not included in the Performance Summary page.
To display the All Metrics page:
-
On the Oracle Enterprise Manager home page, choose Targets.
The Hosts page is displayed.
-
Click All Targets in the top menu bar.
-
Choose the target instance name.
The target instance Home page is displayed.
-
At the bottom of the Home page, under the Related Links menu, click All Metrics.
The All Metrics page is displayed.
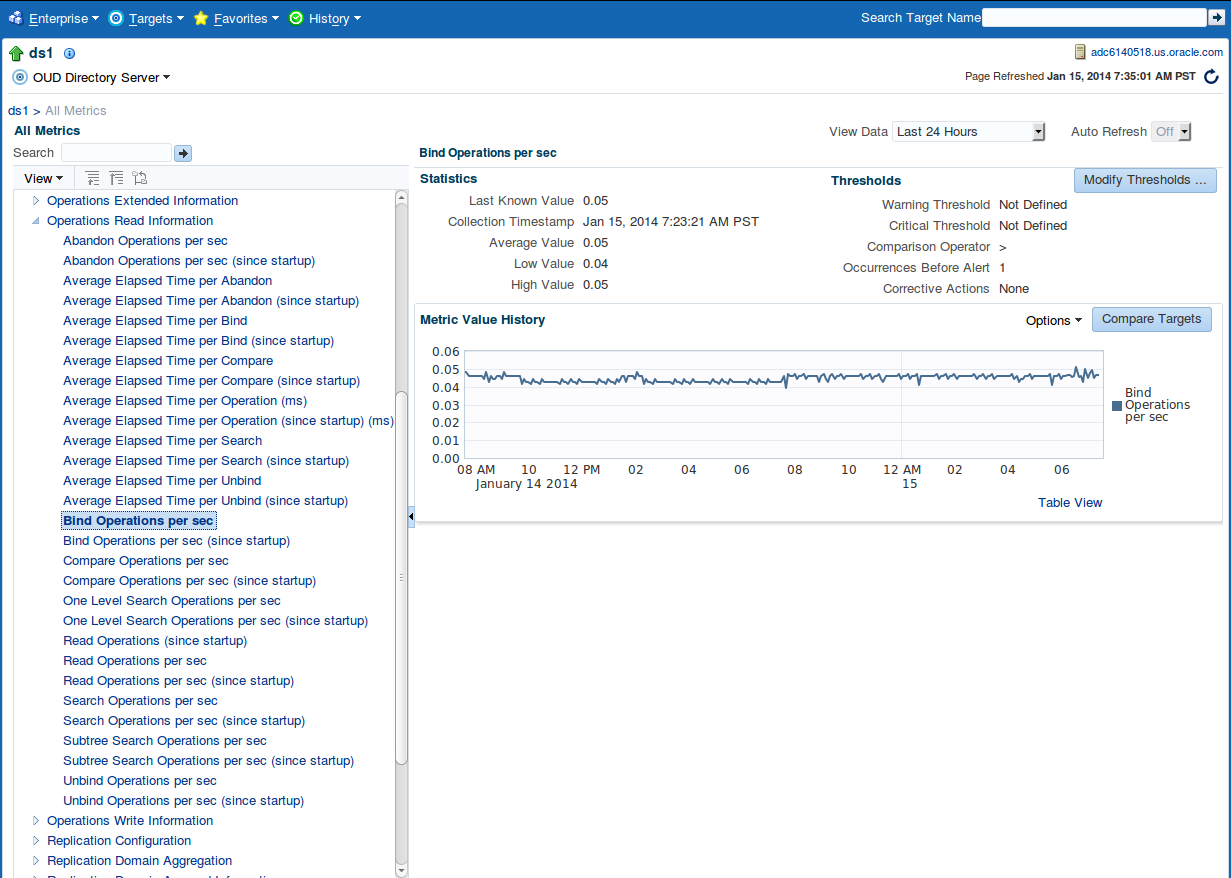
Metrics are organized in logical groups. The following figure illustrates the metrics available when the Operations Read Information group is expanded, and Bind Operations Per Second is selected.
To display details of the metric, click on the metric name. In Figure 1-3, to display information about One Level Search Operations Per Second within the last 24 hours, the One Level Search Operations Per Second metric was chosen from the All Metrics page. A new page dedicated to this metric is displayed.
Figure 1-3 lists the following Statistics: Last Known Value: 0.37, Average Value: 0.14, Low Value: 0.06, High Value: 0.43, Warning Threshold: Not Applicable; Critical Threshold: Not Applicable; Occurrences Before Alert: 0, and Corrective Actions: None. A graph is labeled with metric values ranging from 0.00 to 0.50, and hourly intervals spanning 24 hours. The graph data illustrates activity peaks between the hours of 08AM and 08AM the following day.
Figure 1-3 One Level Search Operations Per Second page
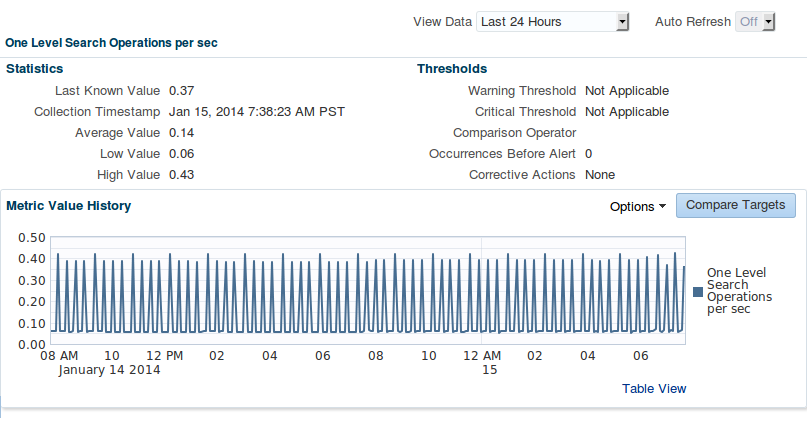
Description of "Figure 1-3 One Level Search Operations Per Second page"
The All Metrics page enables you to specify how you want to view a particular metric. The All Metrics page also provides the ability to compare the metrics against to target instances. Use the View Data field to select a specific time Period for which to display the monitored data. Time Periods for seven days or more also display the minimum, maximum and average values of a metric during that Period.
1.3.3 Setting Metric Thresholds
Metric thresholds enable you to specify when alerts should be generated for a specific monitored metric. For example, if you want to receive an alert when the number of read operations per second exceeds a certain maximum, you can configure a threshold for this metric.
To configure a metric threshold:
-
From the Home page of the Target Instance menu, go to Monitoring > Metric and Collection Settings.
By default, the list of metrics for which thresholds have been defined is displayed. See Figure 1-4.
-
From the View list, select All metrics.
-
Scroll down to locate the metric for which you want to set a threshold.
-
Enter a value in the Warning Threshold column to specify the point at which you should receive a warning alert.
-
Enter a value in the Critical Threshold column to specify the point at which you should receive a critical alert.
-
To change the collection schedule for that metric:
-
Click the existing value in the Collection Schedule column.
-
Edit the collection settings, as required.
-
-
To specify any corrective behavior that should be taken if the metric reaches the warning threshold or critical threshold:
-
Click the Edit icon.
-
On the Monitored Objects pane, click Edit.
-
On the Corrective Actions pane, click Add next to the threshold for which you want to specify the corrective action.
-
Follow the steps in the Add Corrective Action wizard.
-
-
On the Metrics and Collection Settings page, click OK to save your changes.
Figure 1-4 shows the All Metrics view for a directory server target instance. The view contains two tabs: Metrics and Other Collected Items. The Metrics tab contains a table which lists metrics collected for this directory server instance. For each metric, the following values may be reported: Comparison Operator, Warning Threshold, Critical Threshold, Corrective Actions, and Collections Schedule.
To reconfigure the settings for a metric, click the Edit icon the end of its row.
Figure 1-4 The Metric and Collections Settings Page for a Directory Server Target Instance
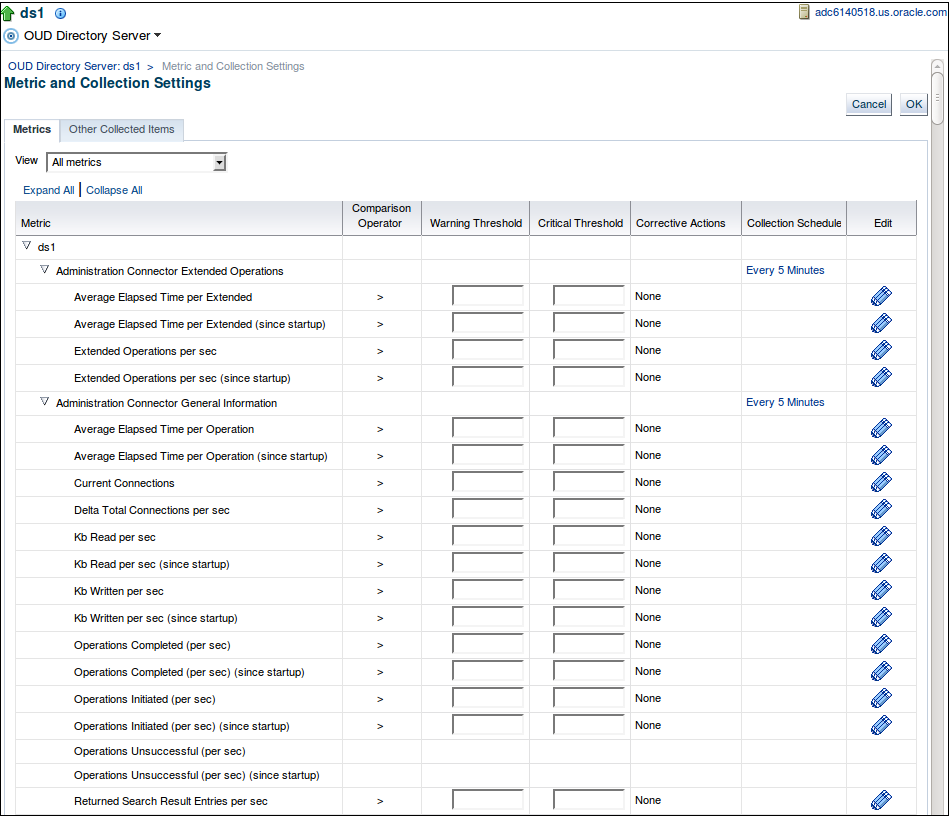
Description of "Figure 1-4 The Metric and Collections Settings Page for a Directory Server Target Instance "
1.3.4 Summary of Directory Server Instance Monitoring Information
1.3.4.1 Directory Server Instance Home Page Metrics
The directory server instance Home page provides the following basic information about the server instance:
-
General Information about the directory server instance and its current status including: up time, the administration port, the full version of the server, install and instance path, server role, and whether replication is enabled or disabled in the LDAP server
-
Availability of the server
-
Current load of the LDAP server including: the number of Operations Per Second, the average etime Per Operation, the number of Connections Per Second, the number of Current Connections, and the Connections Ceak
-
List of configured suffixes and for each suffix, the DN, the entry count in the suffix, and indication of whether the suffix is replicated or not replicated
-
List of configured connection handlers, and each connection handler name and type (such as LDAP, SNMP, JMX and so forth), the Listen Port Number, whether the connection handler is enabled or disabled, Average etime (ms) Per Operation on the connection handler, and the number of Operations Per Second Since the Last Collection
-
Performance overview with line charts indicating the following:
-
The number of Operations Completed Per Second since the server startup, and Operations Completed Per Second Since the Last Collection
-
The eTime Per Operation Since Startup of the server, and the eTime Per Operation Since the Last Collection
-
The number of Connections Per Second Since Startup, and the number of Connections Per Second Since the Last Collection
-
CPU usage
-
In addition, the Home page displays any alerts that might have been generated by the monitored server instance.
1.3.4.2 Directory Server Instance Performance Summary Page Metrics
The OUD Directory Server Performance Summary Page displays the following:
-
Current Load of the server with the number Operations Per Second, the Average eTime, the number of Connections Per Second, the number of Current Connections, and Connections Peak
-
A pie chart representing the number of Completed Operations compared to the Unsuccessful Operations Per Second
-
Two bar charts representing, for each read and write operation type, the number of Operations Per Second
-
For each Operation type, the number of Operations Per Second and the associated elapsed time
1.3.4.3 Directory Server Instance Resources Usage Page Metrics
The OUD Directory Server Resource Summary Page displays the following:
- JVM Information
-
-
VM information like the Java version, Java home, Java Architecture, Max allowed Memory (MB), Total Memory (MB), Used Memory (MB) and the Free Memory (MB)
-
A line chart representing the Free Memory in Heap, and the Used Memory in Heap
-
A line chart representing the JVM Non Heap Usage (MB)
-
- Backends Information
-
-
Berkeley DB JE version, Number of Backends and the total number of Entry Count in the directory server
-
A bar chart representing, for each backend the number of owned entries, the current size of the DB cache and the Free Disk Space
-
- Workqueue Information
-
-
Current Request in the backlog of the workqueue, the Request Backlog Peak, Rejected Requests, and Configured Capacity of the workqueue
-
A line chart representing the number of requests in the queue
-
- Cache Information
-
Entry Cache Hits, Entry Cache Tries, Cached Entries, Cache Hit Ratio, and a line chart representing the number of hits Per Second and the Number of Tries Per Second
1.3.4.4 Directory Server Instance Replication Overview Page Metrics
The OUD Directory Server Replication Overview Page displays the following:
- Local Replication Server
-
-
Administration port
-
Replication Enabled Replication Port, Missing Changes, Oldest Missing Changes, Replication Delay, Received Updates Per Second, Sent Updates Per Second, and Untrusted Changes Per Second
-
A line chart representing the number of Missing Changes in the local replication server
-
A line chart representing the age of the Oldest Missing Changes
-
- Local Replication Domains
-
-
A bar chart representing, for each domain, the average number of Replication Updates Received Per Second for this replication domain
-
A bar chart representing, for each domain, the average number of Replication Updates Sent Per Second for this replication domain
-
- Global Replication Report
-
The Global Replication Report provides a summary of all servers in a replicated topology, as well as the overall replication status across the topology.
Table 1-2 summarizes the metrics reported in the Global Replication Report for each replication domain in the topology:
Table 1-2 Global Replication Report for Each Domain in the Topology
Metric Description Host Name
Name of the host on which the directory server instance is running.
Admin Port
Administration port of the directory server instance.
Base DN
Base DN that is being replicated.
Entries
Number of entries in that base DN.
Replication Status
Status of the replication domain on this directory server. The status can be one of the following:
Replication Ongoing. The connection to a replication server is established with the correct data set. Replication is working. If assured mode is used, then acknowledgements from this directory server are sent. For information about assured mode, see the Oracle® Fusion Middleware Administrator's Guide for Oracle Unified Directory 11g Release 2 (11.1.2).
Degraded. The connection to a replication server is established with the correct data set. Replication is working in degraded mode as the directory server has numerous changes that are pending in the replication server queue. If assured mode is used, then acknowledgements from this directory server are not expected.
Being Initialized. The connection to a replication server is established and a new data set is received from this connection (online import), to initialize the local back end.
Requires Initialization. The connection to a replication server is established with a data set that is different from the rest of the topology. Replication is not working. Either the other directory servers of the topology should be initialized with a compatible data set, or this server should be initialized with another data set that is compatible with the other servers.
Not Connected. The directory server is not connected to any replication server.
Missing Changes
Number of changes that are still missing on this server (and that have been applied to at least one other server in the topology).
Oldest Missing Change
Age (in seconds) of the oldest missing change that has not yet arrived on this server.
Received Updates Per Second
Average number of replication updates received by this server Per Second.
Sent Updates Per Second
Average number of replication updates sent by this server Per Second.
Untrusted Changes Per Second
Average number of changes Per Second that were made on an untrusted server, and not yet replicated to the topology.
Table 1-3 summarizes the metrics reported in the Global Replication Report for each replication server in the topology.
Table 1-3 Global Replication Report for Each Replication Server in the Topology
Metric Description Host Name
Name of the host on which the replication server instance is running.
Replication Port
Replication port of the replication server instance.
Base DN
Base DN that is being replicated.
Missing Changes
Number of changes that still need to be replayed on any server in the topology.
Oldest Missing Change
Age (in seconds) of the oldest missing change from any server in the topology.
Table 1-4 summarizes the metrics reported in the Global Replication Report for the entire topology.
1.3.5 Summary of Proxy Server Instance Monitoring Information
1.3.5.1 Proxy Server Instance Home Page Metrics
The proxy server instance Home page provides the following basic information:
-
General information about the proxy server instance and its current status including: up time, the administration port, the full version of the server, install and instance paths, and server role
-
Availability of the server
-
The current load of the LDAP server with the number of Operations Per Second, the Average etime Per Operation, the number of Connections Per Second, the number of Current Connections, and the Connections Peak
-
List of configured suffixes with the server role, the network groups, and the associated algorithms
-
List of configured connection handlers with the type, the port number, whether connection handler is enabled or disabled, Average etime (ms) Per Operation, and the number of Operations Per Second Since the Last Collection
-
List of remote servers with, for each server, the name, the host name, the port number, the SSL port number, the suffix and workflow element, the status of the remote server, the last up time, and the last down time
-
Performance overview with line charts representing the number of Operations Completed, the Operations eTime, the number of connections, and the CPUusage.
In addition, the Home page displays any alerts that might have been generated by the monitored server instance.
1.3.5.2 Proxy Server Instance Performance Summary Page Metrics
The OUD Proxy Server Performance Summary Page displays the following:
-
Current Load of the server with the number Operations Per Second, the Average eTime, the number of Connections Per Second, the number of Current Connections, and Connections Peak
-
A pie chart representing with the number of completed Operations compared to the Unsuccessful Operations Per Second
-
Two bar charts representing, for each read and write operation, the number of Operations Per Second
-
For each operation type, the number of Operations Per Second and the associated elapsed time
-
Line charts representing the number of Operations Completed, the Operations eTime, the number of connections, and the CPU usage
1.3.5.3 Proxy Server Instance Resource Usage Page Metrics
The OUD Proxy Server Resource Summary Page displays the following:
- JVM Information
-
-
JVM information like the java version, Java home, Java Architecture, Max allowed Memory (MB), Total Memory (MB), Used Memory (MB) and the free memory (MB)
-
A line chart representing the Free Memory in Heap, and the Used Memory in the heap
-
A line chart representing the JVM Non Heap Usage (MB)
-
- Request Backlog Information
-
-
Current Request in the backlog of the workqueue, the request backlog peak, Rejected Requests
-
A line chart representing the number of requests in the queue
-
- Global Index Shared Cache Space Usage Information
-
-
Cache name, Used In, Used Space
-
A line chart representing the amount of Used Space of the global index cache if configured
-
1.3.5.4 Proxy Server Instance Remote Servers Page Metrics
The OUD Proxy Server Remote Servers Page displays the following:
-
List of Remote Data sources with for each remote data sources:
Name, Hostname, Port number, SSL port number, Suffix/WFE, Status, Last Up time, Last Down time, Connection Pool Used, Read Operation Per Second, Writes Operations Per Second, and number of Silent Binds Per Second -
A bar chart representing, for each remote server, the number of Failed Operations, number of Aborted Operations, and the number of Completed Operations
-
A bar chart representing the number of Read Operations for each remote server
-
A bar chart representing the number of Write Operations Per Second for each remote server
-
A bar chart representing, for each remote server, the eTime of Failed Operations, of Aborted Operations and Completed Operations
-
A bar chart representing the eTime of Read Operation for each remote server
-
A bar chart representing the eTime of Write Operations Per Second for each remote server
1.3.6 Summary of Replication Gateway Monitoring Information
1.3.6.1 Replication Gateway Instance Home Page Metrics
The replication gateway instance Home page provides the following basic information:
-
General information about the replication gateway instance and its the current status including: up time, administration port, full version of the server, install and instance paths, server role, and whether replication is enabled or disabled
-
Availability of the server
-
List of configured suffixes with replication status, the Updates Sent to ODSEE Per Second, Updates Received from ODSEE Per Second, Updates Sent to OUD Per Second, and Updates Received from OUD Per Second
-
Performance overview with line charts representing the number of updates sent to ODSEE Per Second, the number of Updates Received from ODSEE Per Second, the number of Updates Sent to OUD Per Second, and the number of Updates Received from OUD Per Second
In addition, the Home page displays any alerts that might have been generated by the monitored replication gateway instance.
1.3.6.2 Replication Gateway Instance Resources Usage Page Metrics
The OUD Replication Gateway Resource Usage Page displays the following:
- JVM Information
-
-
VM information: the Java version, Java home, Java Architecture, Max Allowed Memory (MB), Total Memory (MB), Used Memory (MB) and the Free Memory (MB)
-
A line chart representing the Free Memory in Heap, and the Used Memory in the heap
-
A line chart representing the JVM Non Heap Usage (MB)
-
1.3.6.3 Replication Gateway Instance Replication Overview Page Metrics
The OUD Replication Gateway Replication Overview Page displays the following:
- Local Replication Server
-
-
Administration port
-
Replication Enabled Replication Port, Missing Changes, Oldest Missing Changes, Replication Delay, Received Updates Per Second, Sent Updates Per Second, Untrusted Changes Per Second
-
A line chart representing the number missing changes in the local replication server
-
A line chart representing the age of the Oldest Missing Changes
-
- Local Replication Domains
-
-
A bar chart representing, for each domain, the average number of Replication Updates Received Per Second for this replication domain
-
A bar chart representing, for each domain, the average number of Replication Updates Sent Per Second for this replication domain
-
- Global Replication Report
-
The Global Replication Report provides a summary of all servers in a replicated topology, as well as the overall replication status across the topology.
Table 1-5 summarizes the metrics reported in the Global Replication Report for each replication domain in the topology:
Table 1-5 Global Replication Report for Each Domain in the Topology
Metric Description Host Name
Name of the host on which the directory server instance is running.
Admin Port
Administration port of the directory server instance.
Base DN
Base DN that is being replicated.
Entries
Number of entries in that base DN.
Replication Status
Status of the replication domain on this directory server. The status can be one of the following:
Replication Ongoing. The connection to a replication server is established with the correct data set. Replication is working. If assured mode is used, then acknowledgements from this directory server are sent. For information about assured mode, see the Oracle® Fusion Middleware Administrator's Guide for Oracle Unified Directory 11g Release 2 (11.1.2).
Degraded. The connection to a replication server is established with the correct data set. Replication is working in degraded mode as the directory server has numerous changes that are pending in the replication server queue. If assured mode is used, then acknowledgements from this directory server are not expected.
Being Initialized. The connection to a replication server is established and a new data set is received from this connection (online import), to initialize the local back end.
Requires Initialization. The connection to a replication server is established with a data set that is different from the rest of the topology. Replication is not working. Either the other directory servers of the topology should be initialized with a compatible data set, or this server should be initialized with another data set that is compatible with the other servers.
Not Connected. The directory server is not connected to any replication server.
Missing Changes
Number of changes that are still missing on this server (and that have been applied to at least one other server in the topology).
Oldest Missing Change
Age (in seconds) of the oldest missing change that has not yet arrived on this server.
Received Updates Per Second
Average number of replication updates received by this server per second.
Sent Updates Per Second
Average number of replication updates sent by this server per second.
Untrusted Changes Per Second
Average number of changes per second that were made on an untrusted server, and not yet replicated to the topology.
Table 1-6 summarizes the metrics reported in the Global Replication Report for each replication server in the topology.
Table 1-6 Global Replication Report for Each Replication Server in the Topology
Metric Description Host Name
Name of the host on which the replication server instance is running.
Replication Port
Replication port of the replication server instance.
Base DN
Base DN that is being replicated.
Missing Changes
Number of changes that still need to be replayed on any server in the topology.
Oldest Missing Change
Age (in seconds) of the oldest missing change from any server in the topology.
Table 1-7 summarizes the metrics reported in the Global Replication Report for the entire topology.
1.4 Uninstalling the Enterprise Manager Plug-in for OUD
To uninstall the Enterprise Manager Plug-in for OUD, complete the following tasks:
-
Remove all target instances of the plug-in.
See Section 1.4.1, "To Remove Target Instances of the Plug-in." -
Undeploy the plug-in.
See Section 1.4.2, "Undeploying the Plug-in."
You must remove all target instances of the plug-in before you can undeploy the plug-in. For example, if you have three OUD instances with two instances deployed to one agent and the third instance deployed to a second agent, you must Perform the following tasks:
-
Remove instance 1 (the target instance) on agent 1.
-
Remove instance 2 (the second target instance) on agent 1.
-
Remove instance 3 (the third target instance) on agent 2.
You can then undeploy the plug-in from the Oracle Enterprise Manager Cloud Control.
1.4.1 To Remove Target Instances of the Plug-in
You can remove a target instance by following this procedure. Note that when you remove a target instance, all corresponding data (monitoring data that has already been collected) is deleted.
For each target instance of the plug-in that you want to remove, complete the following steps:
-
Select Targets on the navigation bar from the Oracle Enterprise Manager home page.
The Hosts page is displayed.
-
Select All Targets on the Hosts page.
The All Targets page displays the list of all targets in the Oracle Enterprise Manager Cloud Control including hosts, agents, databases, directory servers and others.
The target instance name is displayed in the Name column.
-
Click Target Setup > Remove Target to select the target instance name.
-
Click Remove.
The following message is displayed: "You have chosen to remove target_instance_name (OUD Directory Server, OUD Proxy Server or OUD Replication Gateway). Do you wish to proceed?"
Click Yes. A confirmation message is displayed.
The target instance has now been removed. Repeat these steps to remove any additional target instances of the Enterprise Manager Plug-in for OUD.
When all target instances of the plug-in have been removed, you can undeploy and then delete the Plug-in from the Oracle Enterprise Manager Cloud Control, as described in the following sections.
1.4.2 Undeploying the Plug-in
Follow the detailed instructions in the following sections of the Oracle Enterprise Manager Cloud Control Administrator's Guide:
-
"Undeploying the Plug-in from Oracle Management Service"
http://docs.oracle.com/cd/E24628_01/doc.121/e24473/plugin_mngr.htm#CJGEIECI -
"Undeploying the Plug-in from Management Agents"
http://docs.oracle.com/cd/E24628_01/doc.121/e24473/plugin_mngr.htm#CJGEFADI
1.5 Limitations of this Release
The following limitations Pertain to the JVM Resources Report that is generated for each of the three server types.
-
The CPU Usage graph is available only if:
-
The target instance is running on the same host as the Management Agent in which the instance is registered
-
The target instance and the Management Agent are running with the same access rights
-
-
The Non-Heap Usage graph is not accurate (the reported metric is incorrect).
-
If Oracle Management Agent is running on an HP-UX system, then OUD instances should be installed on a path which is limited to 70 characters.