1 Microsoft SQL Server Metrics
This chapter provides descriptions for all Microsoft SQL Server metric categories, and the tables list and describe associated metrics for each category. Shaded rows represent key columns for a particular category.
1.1 Viewing Metrics
To view configuration metrics within the plug-in, navigate to the Last Collected configuration metrics page by selecting Configuration, then Last Collected from Microsoft SQL Server.
Figure 1-1 Last Collected Configuration Metrics
Description of "Figure 1-1 Last Collected Configuration Metrics"
To view the performance and status metrics within the plug-in, navigate to the plug-in's All Metrics page by selected Monitoring, then All Metrics from Microsoft SQL Server.
1.2 Access Methods
The metrics in this category search through and measure the allocation of Microsoft SQL Server database objects, such as the number of index searches or number of pages that are allocated to indexes and data.
1.2.1 For Microsoft SQL Server 2005/2008/2012
Default Collection Interval — Every 30 minutes
Table 1-1 Access Methods Metrics
| Metric | Description |
|---|---|
|
Access Method Counter Name (key column) |
Performance metric name. See Table 1-2. |
The Access Method Counter Name key column contains several metrics. Table 1-2 provides a list of these metrics and a description for each.
Table 1-2 Access Method Counter Name Metrics
| Metric | Description |
|---|---|
|
Extents Deallocations/sec |
Number of extents deallocated per second from database objects used for storing index or data records. |
|
Extents Allocated/sec |
Number of extents allocated per second to database objects used for storing index or data records. |
|
Forwarded Records/sec |
Number of records per second fetched through forwarded record pointers. |
|
FreeSpace Page Fetches/sec |
Number of pages returned per second by free space scans used to satisfy requests to insert record fragments. |
|
FreeSpace Scans/sec |
Number of scans per second that were initiated to search for free space in which to insert a new record fragment. |
|
Full Scans/sec |
Number of unrestricted full scans per second, which can be either base-table or full-index scans. |
|
Index Searches/sec |
Number of index searches per second. These are used to start range scans and single index record fetches and to reposition an index. |
|
Mixed Page Allocations/sec |
Number of pages allocated per second from mixed extents. These are used for storing the first eight pages that are allocated to an index or table. |
|
Page Deallocations/sec |
Number of pages deallocated per second from database objects used for storing index or data records. |
|
Page Splits/sec |
Number of page splits per second that occur because of overflowing index pages. |
|
Pages Allocated/sec |
Number of pages allocated per second to database objects used for storing index or data records. |
|
Probe Scans/sec |
Number of probe scans per second. These are used to directly find rows in an index or base table. |
|
Range Scans/sec |
Number of qualified range scans through indexes per second. |
|
Scan Point Revalidations/sec |
Number of times per second that the scan point had to be revalidated to continue the scan. |
|
Skipped Ghosted Records/sec |
Number of ghosted records per second skipped during scans. |
|
Table Lock Escalations/sec |
Number of times locks on a table were escalated. |
|
Workfiles Created/sec |
Number of workfiles created per second. |
|
Worktables Created/sec |
Number of work tables created per second. |
|
Worktables from Cache Base |
Denominator ("base") of a fraction that the performance counter Worktables from Cache ratio represents. |
|
Worktables from Cache Ratio |
Percentage of work tables created where the initial pages were immediately available in the work table cache. |
1.3 Active SQL Cluster Node
The metrics in this category provide details about the active SQL cluster node.
Evaluation and Collection Frequency — Every 30 Minutes
1.4 Agent Status
The metrics in this category provide information regarding the current status of the Agent.
Default Collection Interval — Every 5 minutes
Table 1-4 Agent Status Metrics
| Metric | Description and User Action |
|---|---|
|
Process ID |
Process ID of the Sqlserver Agent process. |
|
Server name |
Name of the Sqlserver instance. |
|
Service Path |
Path of the Sqlserver process. |
|
Sqlserver Agent Status |
Status of the Sqlserver Agent process. When the status is not running, the Microsoft SQL server Agent must be started. |
|
Sqlserver Agent Start |
The start mode of the Sqlserver Agent. |
1.5 Associated Services
The metrics in this category provide information on Microsoft Windows services that are associated with Microsoft SQL Server.
Evaluation and Collection Frequency — Every 15 Minutes
Table 1-5 Associated Services Metrics
| Metric | Description |
|---|---|
|
Process ID |
Process ID of the service. |
|
Service Name |
Name of the associated service. |
|
Service State |
State of the service. |
|
Service Status |
Status of the service. |
|
Start Mode |
Start mode of the service. |
|
Start Name |
Party responsible for starting the service. |
|
System Name |
Name of the system on which the service is running. |
1.6 Buffer Manager
The Buffer Manager object provides counters to monitor how Microsoft SQL Server uses:
-
Memory to store data pages, internal data structures, and the procedure cache.
-
Counters to monitor the physical I/O as Microsoft SQL Server reads database pages from, and writes database pages to, the disk.
1.6.1 For Microsoft SQL Server 2005/2008/2012
Default Collection Interval — Every 15 minutes
Table 1-6 Buffer Manager Metrics
| Metric | Description |
|---|---|
|
Buffer Manager Counter Name (key column) |
Performance metric name. See Table 1-7. |
The Buffer Manager Counter Name key column contains several metrics. Table 1-7 provides a list of these metrics and a description for each.
Table 1-7 Buffer Manager Counter Name Metrics
| Metric | Description |
|---|---|
|
Buffer Cache Hit Ratio |
Percentage of pages found in the buffer cache without having to read from disk. The ratio is the total number of cache hits divided by the total number of cache lookups since Microsoft SQL Server was started. After a long period of time, the ratio does not change very much. Because reading from the cache is much less expensive than reading from disk, this ratio should be high. Generally, you can increase the buffer cache hit ratio by increasing the amount of memory available to Microsoft SQL Server. |
|
Buffer Cache Hit Ratio Base |
Denominator ("base") of a fraction that the performance counter Buffer Cache Hit Ratio represents. |
|
Checkpoint Pages/sec |
Number of pages flushed to disk per second by a checkpoint or other operations that cause all dirty pages to be flushed to disk. |
|
Database Pages |
Total number of database pages. |
|
Free List Stalls/sec |
Number of requests that had to wait for a free page. |
|
Free Pages |
Total number of pages on all free lists. |
|
Lazy Writes/sec |
Number of buffers written per second by the buffer manager's lazy writer. The lazy writer is a system process that flushes out batches of dirty, aged buffers (buffers that contain changes that must be written back to disk before the buffer can be reused for a different page) and make them available to user processes. The lazy writer eliminates the need to perform frequent checkpoints in order to create available buffers. |
|
Page Lookups/sec |
Number of requests to find a page in the buffer pool. |
|
Page Reads/sec |
Number of physical database page reads issued per second. This statistic displays the total number of physical page reads across all databases. Because physical I/O is expensive, you may be able to minimize the cost by using a larger data cache, intelligent indexes, more efficient queries, or by changing the database design. |
|
Page Writes/sec |
Number of database page writes issued per second. Page writes are generally expensive. Reducing page-write activity is important for optimal tuning. One way to do this is to ensure that you do not run out of free buffers in the free buffer pool. If you do, page writes will occur while waiting for an unused cache buffer to flush. |
|
Procedure Cache Pages |
Number of pages used to store compiled queries. |
|
Readahead Pages/sec |
Number of pages read in anticipation of use. |
|
Reserved Pages |
Number of buffer pool reserved pages. |
|
Stolen Pages |
Number of pages used for miscellaneous server purposes (including procedure cache). |
|
Target Pages |
Ideal number of pages in the buffer pool. |
|
Total Pages |
Number of pages in the buffer pool (includes database, free, and stolen pages). |
1.7 Cache Manager
The Cache Manager object provides counters to monitor how Microsoft SQL Server uses memory to store objects such as stored procedures, ad hoc and prepared Transact-SQL statements, and triggers. Multiple instances of the Cache Manager object can be monitored at the same time, with each instance representing a different type of plan to monitor.
1.7.1 For Microsoft SQL Server 2000/2005/2008
Default Collection Interval — Every 15 minutes
Table 1-8 Cache Manager Metrics
| Metric | Description |
|---|---|
|
Cache Manager Counter Name (key column) |
Performance metric name. See Table 1-9. |
|
Cache Manager Instance Name (key column) |
Instance for the Cache Manager counter name. |
The Cache Manager Counter Name key column contains several metrics. Table 1-9 provides a list of these metrics and a description for each.
Table 1-9 Cache Manager Counter Name Metrics
| Metric | Description |
|---|---|
|
Cache Hit Ratio |
Percentage of pages found in the cache without having to read from disk. The ratio is the total number of cache hits divided by the total number of cache lookups since Microsoft SQL Server was started. After a long period of time, the ratio does not change very much. Because reading from the cache is less expensive than reading from disk, this ratio should be high. Generally, you can increase the cache hit ratio by increasing the amount of memory available to Microsoft SQL Server. |
|
Cache Hit Ratio Base |
Denominator ("base") of a fraction that the performance counter Cache Hit Ratio represents. |
|
Cache Pages |
Number of pages used by objects in the cache. After a long period of time, the count does not change very much. |
|
Cache Object Counts |
Number of objects found in the cache. After a long period of time, the count does not change very much. |
|
Cache Use Counts/sec |
Number of times per second that each type of object in the cache has been used. The higher this value is, the better. After a long period of time, the count does not change very much. |
1.8 Cluster Active Group and Node
The metrics in this category provide details about the cluster active group and the node.
1.9 Cluster Active Resource and Node Metrics
The metrics in this category provide details about the cluster active resource and node.
1.10 Cluster Name and Network
The metrics in this category provide details about the cluster name and network.
1.11 Cluster Quorom Resource and Cluster Name
The metrics in this category provide details about the cluster quorom resource and cluster name.
1.12 Cluster Resources
The metrics in this category provide details about cluster resource group.
1.13 Cluster Resource and Group
The metrics in this category provide details about the cluster resource and group.
1.14 Cluster Resource and Type
The metrics in this category provide details about the cluster resource and type.
1.15 Cluster Resource Group and Cluster Name Metrics
The metrics in this category provide details about the cluster resource group and cluster name.
1.16 Cluster Resource and Owner Node Name
The metrics in this category provide details about the cluster resource and owner node.
1.17 Cluster Resource and Cluster Name
The metrics in this category provide details about the cluster resource and cluster name.
1.18 Cluster Resource Group and Preferred Node
The metrics in this category provide details about the cluster resource group and preferred node.
1.19 Configuration Metrics
Configuration metrics consist of the following categories:
-
SQL Server Configuration
-
Registry Setting Configuration
-
Database Setting Configuration
1.19.1 SQL Server Configuration Metrics
The metrics in this category represent a Microsoft SQL Server installation. The metrics contain details of the product and version of the Microsoft SQL Server instance.
-
Table Name — MGMT_EMX_MSSQL_SQLSERVER
-
View Name — MGMT_EMX_MSSQL_SQLSERVER_VIEW
Default Collection Interval — Every 7 Days
Table 1-21 SQL Server Configuration Metrics
| Metric | Description |
|---|---|
|
Server Name |
Name of the SQL Server. |
|
Clustered |
Whether the server belongs to a cluster. |
|
Package |
Product installed.
|
|
Product |
Installed product. |
|
Version String |
Installed version. |
|
Operatingsystem Details |
Operating system on which the installation is done. |
|
Version Name |
Installed version including revision. |
|
HADR Enabled |
Whether AlwaysOn high-availability disaster recovery is enabled. |
|
Database Service Pack |
Installed SQL Server service pack |
|
Edition |
Installed SQL Server edition. |
1.19.2 Registry Setting Configuration Metrics
The metrics in this category contain the installation and run-time parameters of the SQL Server stored in the registry.
-
Table Name — MGMT_EMX_MSSQL_REGSETTING
-
View Name — MGMT_EMX_MSSQL_REGSETTING_VIEW
Default Collection Interval — Every 7 Days
Table 1-22 Registry Setting Configuration Metrics
| Metric | Description |
|---|---|
|
Agent Log File |
Path and file name for the Agent log. |
|
Backup Directory |
Location of the backup files directory. |
|
Case Sensitive |
Comparison method for multi-byte character data is either case-sensitive or not. |
|
Error Log Path |
Operating system path and file name to be used for the SQL Server error log. |
|
Master DB Path |
The full path and file name of the operating system file containing the master database. |
|
NT Event Logging |
Whether the SQL Server uses the Windows NT application log. If TRUE, the SQL Server sends all events to the Windows NT application log and the SQL Server error log. If FALSE, the SQL Server sends events only to the SQL Server error log. |
|
Number of Processors |
Number of CPUs available to the SQL Server on the server. |
|
Perf Mon Mode |
Operating system path and file name to be used for the SQL Server error log. Windows NT Performance Monitor polling behavior when the monitor is launched.
|
|
Registered Organization |
Company name supplied by the installer. |
|
Registered Owner |
User name supplied by the installer. |
|
Replication Installed |
TRUE when components supporting replication are installed. |
|
RPC Encrypt |
Whether RPC encryption is enabled. |
|
SNMP |
Whether Simple Network Management Protocol (SNMP) is installed on an instance of the SQL Server. |
|
SNMP Current Version |
Version of Simple Management Protocol (SNMP) currently installed on an instance of the SQL Server. |
|
Sort Order |
Character set used and ordering applied. |
|
SQL Data Root |
Default operating system directory implementing storage for SQL Server system user-defined databases. |
|
TCP Port |
TCP/IP Sockets Net-Libraries port number on an instance of the SQL Server. |
1.19.3 Database Setting Configuration Metrics
The metrics in this category contain the settings for a database. These settings control the access to and the behavior of the database.
-
Table Name — MGMT_EMX_MSSQL_DBSETTING
-
View Name — MGMT_EMX_MSSQL_DBSETTING_VIEW
Default Collection Interval — Every 7 Days
Table 1-23 Database Setting Configuration Metrics
| Metric | Description |
|---|---|
|
Database Name (key column) |
Database name. |
|
Offline |
Whether the database is online. Also, whether the database is unavailable, or is being made unavailable, for use by authorized users. |
|
Recovery Type |
Whether the comparison method for multi-byte character data is case-sensitive or not. Type of recovery model that a database will use:
|
|
AutoClose |
Whether the database is closed and its resources are freed when no user connection accesses the database. |
|
AutoCreateStatistics |
Whether the optimizer directs automatic creation of supporting data statistics as required. |
|
AutoShrink |
Whether operating system files maintaining table and index data are evaluated for downward resizing when the server periodically checks for unused space. |
|
AutoUpdateStatistics |
Whether the optimizer directs the automatic rebuilding of statistics. |
|
CursorCloseOnCommit |
Whether cursors are closed when a transaction is completed. |
|
DataSpaceUsage |
Amount of space in use and reserved for use of data in megabytes. |
|
IndexSpaceUsage |
Amount of space for the index in megabytes. |
|
DB Owner UseOnly |
Whether only users with the database ownership privilege can access the database. |
|
SingleUser Mode |
Whether only one user can access the database at a given time. |
|
ReadOnly |
Whether the database is read-only. |
|
DefaultCursor |
Whether cursors declared in a batch are created with local scope. |
|
SelectIntoBulkCopy |
Whether non-logged operations are allowed. |
|
TruncateLogOnChekpoint |
Whether the SQL Server removes log entries referencing committed transactions when activity on the databases forces a dirty page write. |
|
Member of an Availability Group |
Whether the database is a member of an AlwaysOn availability group. |
1.20 Connection Statistics
The metrics in this category provide information about the number of connections available and used.
Evaluation and Collection Frequency — Every 15 Minutes
1.21 Database
The MSSQL_Database class represents a SQL Server database. Each SQL Server installation can contain one or more databases.
Default Collection Interval — Every 15 minutes
| Metric | Description and User Action |
|---|---|
|
Database Name (key column) |
Database name. |
|
Create Date |
Time and date the database was created. |
|
Database File Path |
Primary location of the database files. |
|
Database Mirroring State |
State of the mirror database and the database mirroring session. |
|
Database Mirroring Partner Name |
Server name of the database mirroring partner. |
|
Database Mirroring Partner Instance |
The instance name for the other partner. |
|
Database Status |
Status of the database:
|
|
Database Size (MB) |
Total size of the database in megabytes. Allocate more space to the database if this metric decreases beyond the critical threshold. |
|
Database Space Available % |
Percentage of space that is available. Allocate more space to the database if this metric decreases beyond the critical threshold. |
|
Auto-growth Potential Space (MB) |
Amount of disk space available for the database to grow in to based on its autogrowth settings. |
|
Version |
Version of Microsoft SQL Server used to create the referenced database. |
|
Database Owner |
The owner of the database |
|
Database ID |
The ID of the database |
1.22 Database Backup
The metrics in this category provide detailed backup information for all databases.
Default Collection Interval — in real time
Table 1-27 Database Backup Metrics
| Metric | Description |
|---|---|
|
Backup Set ID (key column) |
Unique backup set identification number that identifies the backup set. |
|
Media Set ID (key column) |
Unique media set identification number that identifies the media set containing the backup set. |
|
Family Sequence Number (key column) |
Position of this media family in the media set. |
|
File Number (key column) |
File identification number unique within a database. |
|
Mirror Number (key column) |
Mirror identification number unique within a database. |
|
Backup Set Name |
Name of the backup set. Can be NULL |
|
Backup Set Description |
Description of the backup set. Can be NULL. |
|
Username |
Name of the user performing the backup operation. Can be NULL. |
|
Start Date |
Date and time the backup operation started. Can be NULL. |
|
Finish Date |
Date and time the backup operation finished. Can be NULL. |
|
Size of Backup (bytes) |
Size of the backup set, in bytes. Can be NULL. |
|
Database Name |
Name of the database involved in the backup operation. Can be NULL. |
|
Server Name |
Name of the server running the SQL Server backup operation. Can be NULL. |
|
Machine Name |
Name of the computer running SQL Server. Can be NULL. |
|
Media Set Name |
Name of the media set. Can be NULL. |
|
Media Set Device Name |
Physical name of the backup device. Can be NULL. |
|
Physical Block Size (Bytes) |
Physical block size used to write the media family. Can be NULL. |
|
File Group Name |
Name of the filegroup containing a backed up database file. Can be NULL. |
|
File Group Physical Name |
Remainder of the physical (operating system) file name. Can be NULL. |
|
Backup Set Expiration Date |
Date and time the backup set expires. Can be NULL. |
1.23 Database IOPS Metrics
The metrics in this category provide information on the read and write load on each database.
Evaluation and Collection Frequency — Every 15 Minutes
Table 1-28 Database IOPS Metrics
| Metric | Description |
|---|---|
|
Bytes Read per second |
Number of bytes read per second by this database. |
|
Bytes Written per second |
Number of bytes written per second by this database. |
|
Database Name |
Name of the database. |
|
Reads per second |
Number of reads performed per second by this database. |
|
Writes per second |
Number of writes performed per second by this database. |
1.24 Database Job
The metrics in this category return information about jobs that are used by the SQLServerAgent service to perform automated activities in Microsoft SQL Server.
Default Collection Interval — Every 2 hours
Table 1-29 Database Job Metrics
| Metric | Description and User Action |
|---|---|
|
Computer Used to Send Network Messages |
Name of the user or computer used when sending network messages. |
|
Computer Used to Send Pages |
Name of the user or computer used when sending a page. |
|
Current Execution Status |
|
|
Current Execution Steps in the Job |
Current job execution step. |
|
Current Retry Attempt |
If the job is running and the step has been retried, this is the current retry attempt. |
|
Delete Job Event |
Bitmask indicating under what circumstances the job should be deleted when a job completes. Possible values are the same as for notify_level_eventlog. |
|
Description |
Description for the job. |
|
Email of Operator |
Email name of the operator to notify. |
|
Enabled |
Indicates whether the job is enabled to be executed. |
|
ID of Next Run Schedule |
Identification number of the next run schedule. |
|
Job Category |
The category to which the job belongs. |
|
Job Creation Date |
Date the job was created. |
|
Job ID (key column) |
Job identification number. |
|
Job Modification Date |
Date the job was last modified. |
|
Job Owner |
The owner of the job. |
|
Job Type |
|
|
Job Version Number |
Version of the job, which is automatically updated each time the job is modified. |
|
Last Run Date (mm-dd-yyyy) |
Date the job last started executing. |
|
Last Run Outcome |
Outcome of the job the last time it ran:
|
|
Last Run Time (hh:mm:ss) |
Time the job last started executing. |
|
Name |
Name of the job. |
|
Next Run Date (mm-dd-yyyy) |
Date the job is next scheduled to run. |
|
Next Run Time (hh:mm:ss) |
Time the job is next scheduled to run. |
|
Notify Level Email |
Bitmask indicating under what circumstances a notification email should be sent when a job completes. Possible values are the same as for notify_level_eventlog. |
|
Notify Level Event Log |
Bitmask indicating under what circumstances a notification event should be logged to the Microsoft Windows NT application log. Possible values:
|
|
Notify Level Net Send |
Bitmask indicating under what circumstances a network message should be sent when a job completes. Possible values are the same as for notify_level_eventlog. |
|
Notify Level Page |
Bitmask indicating under what circumstances a page should be sent when a job completes. Possible values are the same as for notify_level_eventlog. |
|
Number of Job Schedules |
Number of job schedules the job has. |
|
Number of Job Steps |
Number of job steps the job has. |
|
Number of Target Servers |
Number of target servers the job has. |
|
Originating Server |
Name of the server from which the job originated. |
|
Start Step ID |
ID of the step in the job where execution should begin. |
1.25 Database Lock
The metrics in this category report information about locks.
Default Collection Interval — Every 15 minutes
Table 1-30 Database Lock Metrics
| Metric | Description |
|---|---|
|
Server Process Identifier (key column) |
Server process ID of the current user process. |
|
Database Identifier (key column) |
Database identification number requesting a lock. |
|
Object Identifier (key column) |
Object identification number of the object requesting a lock. |
|
Index Identifier (key column) |
Deprecated. Always returns 0. |
|
Mode |
Lock mode:
|
|
Resource |
Lock resource that corresponds to the value in syslockinfo.restext: RID, KEY, PAG, EXT, TAB, and DB |
|
Lock Request Status |
The current status of the lock: GRANT, WAIT, and CNVT |
|
Type |
The lock type:
|
|
Resource Type |
Type of resource being locked. This presents the same data as the Type metric:
|
1.26 Database Parameter
The Databases object in Microsoft SQL Server provides counters to monitor:
-
Bulk copy operations.
-
Backup and restore throughput.
-
Transaction log activities.
Monitoring transactions and the transaction log determine how much user activity is occurring in the database and how full the transaction log is becoming. The amount of user activity can determine the performance of the database and affect log size, locking, and replication. Monitoring low-level log activity to gauge user activity and resource usage can help you identify performance bottlenecks.
Default Collection Interval — Every 24 hours
Table 1-31 Database Parameter Metrics
| Metric | Description and User Action |
|---|---|
|
Parameter Name (key column) |
Name of the Database Configuration parameter. |
|
Current Value |
Current value of the Database Configuration parameter. |
|
Description |
Text description of the configuration value. |
|
Dynamic Reconfigure |
Whether the parameter can be dynamically reconfigured. If TRUE, a modification to the value is immediately effective. If FALSE, modifications are visible only after the SQL Server service has been stopped and restarted. |
|
ID |
Parameter name. |
|
Maximum Value |
Upper bound for a configuration value. |
|
Minimum Value |
Lower bound for a configuration value. |
|
Running Value |
Value for the configuration option (value in syscurconfigs.value). |
Table 1-32 ID Description Mapping
| Metric | Description |
|---|---|
|
101 |
Recovery interval. |
|
102 |
Allow updates. |
|
103 |
User Connections. |
|
106 |
Locks. |
|
107 |
Open objects |
|
109 |
Fill factor. |
|
115 |
Nested triggers. |
|
117 |
Remote access. |
|
124 |
Default language. |
|
125 |
Language in cache. |
|
502 |
Max async I/O. |
|
503 |
Max worker threads. |
|
505 |
Network packet size. |
|
518 |
Show advanced option. |
|
542 |
Remote proc trans. |
|
543 |
Remote conn timeout. |
|
1110 |
Time slice. |
|
1123 |
Default sort order ID. |
|
1124 |
Unicode local ID. |
|
1125 |
Unicode comparison style. |
|
1126 |
Language neutral. |
|
1127 |
Two-digit year cutoff. |
|
1505 |
Index create mem. |
|
1514 |
Spin Counter. |
|
1517 |
Priority boost. |
|
1519 |
Remote login timeout. |
|
1520 |
Remote query timeout. |
|
1531 |
Cursor threshold. |
|
1532 |
Set working set size. |
|
1533 |
Resource timeout. |
|
1534 |
User Options. |
|
1535 |
Processor affinity mask. |
|
1536 |
Max text repl size. |
|
1537 |
Media retention. |
|
1538 |
Cost threshold for parallelism. |
|
1539 |
Max degree of parallelism. |
|
1540 |
Min memory per query. |
|
1541 |
Query wait. |
|
1542 |
VLM size. |
|
1543 |
Min memory. |
|
1544 |
Max memory. |
|
1545 |
Query max time. |
|
1546 |
Lightweight pooling. |
1.27 Database Performance
The Databases object in Microsoft SQL Server provides counters to monitor:
-
Bulk copy operations.
-
Backup and restore throughput.
-
Transaction log activities.
Monitoring transactions and the transaction log determine how much user activity is occurring in the database and how full the transaction log is becoming. The amount of user activity can determine the performance of the database and affect log size, locking, and replication. Monitoring low-level log activity to gauge user activity and resource usage can help you identify performance bottlenecks.
1.27.1 For Microsoft SQL Server 2005/2008/2012
Default Collection Interval — Uploads data when an alert is raised
Table 1-33 Database Performance Metrics
| Metric | Description |
|---|---|
|
Database Performance Counter Name (key column) |
Performance metric name. See Table 1-34. |
|
Database Performance Instance Name (key column) |
Instance for the Database Performance Counter Name |
|
Database Performance Server Locks Counter Value |
Performance metric value. |
The Database Performance Counter Name key column contains several metrics. Table 1-34 provides a list of these metrics and a description for each.
Table 1-34 Database Performance Counter Name Metrics
| Metric | Description |
|---|---|
|
Active Transactions |
Number of active transactions for the database. |
|
Backup/Restore Throughput/sec |
Read/write throughput for backup and restore operations of a database per second. For example, you can measure how the performance of the database backup operation changes when more backup devices are used in parallel or when faster devices are used. Throughput of a database backup or restore operation allows you to determine the progress and performance of your backup and restore operations. |
|
Bulk Copy Rows/sec |
Number of rows bulk-copied per second. |
|
Bulk Copy Throughput/sec |
Amount of data bulk-copied in kilobytes per second. |
|
Data File(s) Size (KB) |
Cumulative size (in kilobytes) of all the data files in the database including any automatic growth. Monitoring this counter is useful, for example, for determining the correct size of tempdb. |
|
DBCC Logical Scan Bytes/sec |
Number of logical read scan bytes per second for database consistency checker (DBCC) statements. |
|
Log Bytes Flushed/sec |
Total number of log bytes flushed. |
|
Log Cache Hit Ratio |
Percentage of log cache reads satisfied from the log cache. |
|
Log Cache Reads/sec |
Reads performed per second through the log manager cache. |
|
Log File(s) Size |
Cumulative size in kilobytes of all the transaction log files in the database. |
|
Log File(s) Used Size (KB) |
The cumulative used size of all the log files in the database. |
|
Log Flush Wait Time |
Total wait time in milliseconds to flush the log. |
|
Log Flush Waits/sec |
Number of commits per second waiting for the log flush. |
|
Log Flushes/sec |
Number of log flushes per second. |
|
Log Growths |
Total number of times the transaction log for the database has expanded. |
|
Log Shrinks |
Total number of times the transaction log for the database has contracted. |
|
Log Truncations |
Total number of times the transaction log for the database has truncated. |
|
Percent Log Used |
Percentage of space in the log that is in use. |
|
Repl. Pending Xacts |
Number of transactions in the transaction log of the publication database marked for replication, but not yet delivered to the distribution database. |
|
Repl. Trans. Rate |
Number of transactions per second read out of the transaction log of the publication database and delivered to the distribution database. |
|
Shrink Data Movement Bytes/sec |
Amount of data being moved per second by autoshrink operations, DBCC SHRINKDATABASE, or DBCC SHRINKFILE statements. |
|
Transactions/sec |
Number of transactions started for the database per second. |
1.28 Database Status
The metrics in this category provide status metrics on which various thresholds can be set.
Evaluation and Collection Frequency — Every 15 Minutes
Table 1-35 Database Status Metrics
| Metric | Description |
|---|---|
|
Database Name |
Name of the database. |
|
Status |
Status of the database. |
|
ONLINE |
Indicates whether the database status is ONLINE (Yes/No). |
|
OFFLINE |
Indicates whether the database status is OFFLINE (Yes/No) |
|
RESTORING |
Indicates whether the database status is RESTORING (Yes/No). |
|
RECOVERING |
Indicates whether the database status is RECOVERING (Yes/No) |
|
RECOVERY PENDING |
Indicates whether the database status is RECOVERY PENDING (Yes/No) |
|
SUSPECT |
Indicates whether the database status is SUSPECT (Yes/No) |
|
EMERGENCY |
Indicates whether the database status is EMERGENCY (Yes/No) |
1.29 Detailed Response
This metric category provides information about the response of the server.
Evaluation and Collection Frequency — Every 15 Minutes
1.30 Event Log Entry
The MSSQL_ErrorLogEntry class represents the entries in a SQL Service error log.
Default Collection Interval — Metric is disabled. Uploads data when an alert is raised.
Table 1-37 Event Log Entry Metrics
| Metric | Description |
|---|---|
|
Type of Record (key column) |
Specifies the type of event. This is an enumerated string |
|
Record Number (key column) |
Identifies the event within the Windows logfile (for example, NT Eventlog logfile). This is specific to the logfile and is used together with the logfile name to uniquely identify an instance of this class. |
|
Event Log Entry |
Name of the Windows logfile (for example, NT Eventlog logfile). This is used together with the RecordNumber to uniquely identify an instance of this class. |
|
Event Code |
This property has the value of the lower 16-bits of the EventIdentifier property. It is present to match the value displayed in the NT Event Viewer. Two events from the same source may have the same value for this property but may have different severity and EventIdentifier values |
|
Event Identifier |
Identifies the event. This is specific to the source that generated the event log entry, and is used, together with SourceName, to uniquely identify an NT event type. |
|
Event Severity |
Indicates the severity of the event. Two events from the same source may have may have different severity and EventIdentifier values. |
|
Category |
Specifies a subcategory for this event. This subcategory is source specific. |
|
User |
User name of the logged on user when the event occurred. If the user name cannot be determined this will be NULL. |
|
Event Message |
Event message as it appears in the NT Eventlog. This is a standard message with zero or more insertion strings supplied by the source of the NT event. The insertion strings are inserted into the standard message in a predefined format. If there are no insertion strings or there is a problem inserting the insertion strings, only the standard message will be present in this field. |
1.31 General Statistics
The General Statistics object in Microsoft SQL Server provides counters to monitor general server-wide activity, such as the number of current connections and the number of users connecting and disconnecting per second from computers running an instance of SQL Server. This can be useful when you are working on large online transaction processing (OLTP) systems where many clients connect and disconnect from an instance of SQL Server.
1.31.1 For Microsoft SQL Server 2005/2008/2012
Default Collection Interval — Every 30 minutes
Table 1-38 General Statistics Metrics
| Metric | Description |
|---|---|
|
General Statistics Counter Name (key column) |
Performance metric name. See Table 1-39. |
|
General Statistics Counter Value |
Performance metric value. |
The General Statistics Counter Name key column contains several metrics. Table 1-39 provides a list of these metrics and a description for each.
Table 1-39 General Statistics Counter Name Metrics
| Metric | Description |
|---|---|
|
Logins/sec |
Total number of logins started per second. |
|
Logouts/sec |
Total number of logout operations started per second. |
|
User Connections |
Number of user connections. Because each user connection consumes some memory, configuring overly high numbers of user connections could affect throughput. User connections should be set to the maximum expected number of concurrent users. |
1.32 HADR Availability Groups
The metrics in this category provide status and health information about AlwaysOn high-availability disaster recovery availability groups.
Evaluation and Collection Frequency — Every 30 Minutes
Table 1-40 HADR Availability Groups Metrics
| Metric | Description |
|---|---|
|
Group ID |
Availability group unique ID. |
|
Group Name |
Availability group name. |
|
Synchronization Health |
Summary of the synchronization state for the replicas in the availability group. |
|
Failure Condition Level |
Condition under which an automatic failover is triggered. |
1.33 HADR Availability Group Replicas
The metrics in this category provide status and health information about AlwaysOn high-availability disaster recovery availability replicas.
Evaluation and Collection Frequency — Every 30 Minutes
Table 1-41 HADR Availability Group Replicas Metrics
| Metric | Description |
|---|---|
|
Replica ID |
Availability replica unique ID. |
|
Group ID |
Availability group unique ID. |
|
Server Name |
SQL Server server/instance name hosting the replica. |
|
Availability Mode |
Replica availability mode.
|
|
Availability Mode Description |
Label of the replica availability mode. |
|
Role |
Current role of this replica in the availability group.
|
|
Role Description |
Label of the replica role. |
|
Connected State |
Indicates whether a secondary replica is currently connected to the primary replica.
|
|
Connected State Description |
Label of the replica connected state. |
|
Synchronization Health |
Summary of the synchronization state for the databases in the availability group.
|
|
Endpoint URL |
Database mirroring endpoint used for synchronization. |
1.34 HADR Cluster Members
The metrics in this category provide status and health information about members in a AlwaysOn high-availability disaster recovery cluster.
Evaluation and Collection Frequency — Every 30 Minutes
Table 1-42 HADR Cluster Members Metrics
| Metric | Description |
|---|---|
|
Member Name |
Availability group cluster member name. |
|
Member Type |
Type of member.
|
|
Member Type Description |
Label of the member type. |
|
Member State |
State of the cluster member.
|
|
Member State Description |
Label of the member state. |
1.35 Index/Table Fragmentation Metrics
The metrics in this category provide information of the defragment level of Microsoft SQL Server 2005. Currently, this metric is not applicable for Microsoft SQL Server 2000. To retrieve data for this metric, DMV "sys.dm_db_index_physical_stats" is queried for each database (for all objects, indices and partitions). The scan level mode to obtain the statistics is DEFAULT or NULL (that is, equivalent to LIMITED), which is the fastest mode and scans the smallest number of pages.
Evaluation and Collection Frequency — Every SUN
Table 1-43 Index/Table Fragmentation Metrics
| Metric | Description |
|---|---|
|
Database ID (key column) |
Database ID number |
|
Object ID (key column) |
Object ID number |
|
Index ID (key column) |
Index ID number |
|
Partition Number (key column) |
Partition number |
|
Index Type Description (key column) |
Index type description, such as CLUSTERED INDEX, and HEAP. |
|
Allocation Unit type Description |
Description of the allocation unit type:
The LOB_DATA allocation unit contains the data that is stored in columns of type text, ntext, image, varchar(max), nvarchar(max), varbinary(max), and xml. For more information, see Data Types (Transact-SQL). The ROW_OVERFLOW_DATA allocation unit contains the data that is stored in columns of type varchar(n), nvarchar(n), varbinary(n), and sql_variant that have been pushed off-row. For more information, see Row-Overflow Data Exceeding 8 KB. |
|
Number of Index levels |
1 = Heap, or LOB_DATA or ROW_OVERFLOW_DATA allocation unit. |
|
Current Level of Index |
Zero for index leaf levels, heaps, and LOB_DATA or ROW_OVERFLOW_DATA allocation units. Greater than zero for nonleaf index levels. index_level will be the highest at the root level of an index. The nonleaf levels of indexes are only processed when mode = DETAILED. |
|
Average Fragmentation in Percent |
Logical fragmentation for indexes, or extent fragmentation for heaps in the IN_ROW_DATA allocation unit. The value is measured as a percentage and takes into account multiple files. For definitions of logical and extent fragmentation, see Remarks. Zero for LOB_DATA and ROW_OVERFLOW_DATA allocation units. NULL for heaps when mode = SAMPLED. Upload Frequency - After every sample. Alert Text - Average fragmentation for %indexid% is %avg_fragmentation_in_percent%%% where Database ID is %database_id%, Object ID is %object_id% ,Index ID is %index_id%,Partition Number is %partition_number% and Index type Description is %index_type_desc%. It has crossed warning (%warning_threshold%%%) or critical (%critical_threshold%%%) threshold. Multiple Thresholds - For this metric you can set different warning and critical threshold values for each unique combination of " Database ID ", " Object ID ", " Index ID ", " Partition Number ", and " Index type Description " objects. If warning or critical threshold values are currently set for any unique combination of " Database ID ", " Object ID ", " Index ID ", " Partition Number ", and " Index type Description " objects, those thresholds can be viewed on the Metric Detail page for this metric. To specify or change warning or critical threshold values for each unique combination of "Database ID", "Object ID", "Index ID", "Partition Number", and "Index type Description" objects, use the Edit Thresholds page. |
|
Number of fragments in the leaf level |
Number of fragments in the leaf level of an IN_ROW_DATA allocation unit. For more information about fragments, see Remarks. NULL for nonleaf levels of an index, and LOB_DATA or ROW_OVERFLOW_DATA allocation units. NULL for heaps when mode = SAMPLED. |
|
Average number of pages in one fragment |
Average number of pages in one fragment in the leaf level of an IN_ROW_DATA allocation unit. NULL for nonleaf levels of an index, and LOB_DATA or ROW_OVERFLOW_DATA allocation units. NULL for heaps when mode = SAMPLED. |
|
Total number of index or data pages |
For an index, the total number of index pages in the current level of the b-tree in the IN_ROW_DATA allocation unit. For a heap, the total number of data pages in the IN_ROW_DATA allocation unit. For LOB_DATA or ROW_OVERFLOW_DATA allocation units, total number of pages in the allocation unit. |
|
Average(%) of available data storage space used |
Average percentage of available data storage space used in all pages. For an index, average applies to the current level of the b-tree in the IN_ROW_DATA allocation unit. For a heap, the average of all data pages in the IN_ROW_DATA allocation unit. For LOB_DATA or ROW_OVERFLOW DATA allocation units, the average of all pages in the allocation unit. NULL when mode = LIMITED. Upload Frequency - After every sample. Alert Text - Average percentage of available data storage space used in all pages for %indexid% is %avg_page_space_used_in_percent%%% where Database ID is %database_id%, Object ID is %object_id% , Partition Number is %partition_number% and Index type Description is %index_type_desc%.It has fallen below warning (%warning_threshold%%%) or critical (%critical_threshold%%%) threshold. Multiple Thresholds - For this metric you can set different warning and critical threshold values for each unique combiation of "Database ID", "Object ID", "Index ID", "Partition Number", and "Index type Description " objects. If warning or critical threshold values are currently set for any unique combination of "Database ID", "Object ID", "Index ID", "Partition Number", and "Index type Description" objects, those thresholds can be viewed on the Metric Detail page for this metric. To specify or change warning or critical threshold values for each unique combination of "Database ID", " Object ID ", " Index ID ", "Partition Number", and "Index type Description" objects, use the Edit Thresholds page. |
|
Total number of records |
Total number of records. For an index, total number of records applies to the current level of the b-tree in the IN_ROW_DATA allocation unit. For a heap, the total number of records in the IN_ROW_DATA allocation unit. Note: For a heap, the number of records returned from this function might not match the number of rows that are returned by running a SELECT COUNT(*) against the heap. This is because a row may contain multiple records. For example, under some update situations, a single heap row may have a forwarding record and a forwarded record as a result of the update operation. Also, most large LOB rows are split into multiple records in LOB_DATA storage. For LOB_DATA or ROW_OVERFLOW_DATA allocation units, the total number of records in the complete allocation unit. NULL when mode = LIMITED. |
|
Number of ghost records ready for removal |
Number of ghost records ready for removal by the ghost cleanup task in the allocation unit. Zero for nonleaf levels of an index in the IN_ROW_DATA allocation unit. NULL when mode = LIMITED. |
|
Number of ghost records retained in an allocation unit |
Number of ghost records retained by an outstanding snapshot isolation transaction in an allocation unit. Zero for nonleaf levels of an index in the IN_ROW_DATA allocation unit. NULL when mode = LIMITED. |
|
Minimum record size in bytes |
For an index, minimum record size applies to the current level of the b-tree in the IN_ROW_DATA allocation unit. For a heap, the minimum record size in the IN_ROW_DATA allocation unit. For LOB_DATA or ROW_OVERFLOW_DATA allocation units, the minimum record size in the complete allocation unit. NULL when mode = LIMITED. |
|
Maximum record size in bytes |
For an index, the maximum record size applies to the current level of the b-tree in the IN_ROW_DATA allocation unit. For a heap, the maximum record size in the IN_ROW_DATA allocation unit. For LOB_DATA or ROW_OVERFLOW_DATA allocation units, the maximum record size in the complete allocation unit. NULL when mode = LIMITED. |
|
Average record size in bytes |
For an index, the average record size applies to the current level of the b-tree in the IN_ROW_DATA allocation unit. For a heap, the average record size in the IN_ROW_DATA allocation unit. For LOB_DATA or ROW_OVERFLOW_DATA allocation units, the average record size in the complete allocation unit. NULL when mode = LIMITED. |
|
Number of records in a heap that have forward pointers |
Number of records in a heap that have forward pointers to another data location. (This state occurs during an update, when there is not enough room to store the new row in the original location.) NULL for any allocation unit other than the IN_ROW_DATA allocation units for a heap. NULL for heaps when mode = LIMITED. |
|
Database Name |
The name of the database. |
|
Object Name |
The name of the object. |
|
Index Name |
The name of the index. |
1.36 Index Usage
This metric category provides information about index operations.
Default Collection Interval — Every 60 minutes
Table 1-44 Index Usage Metrics
| Metric | Description |
|---|---|
|
Database Name |
Name of the database. |
|
Database ID |
Database identifier |
|
Table or View Name |
Name of the table or view. |
|
Table or View ID |
Identifier of the table or view. |
|
Index Name |
Name of the index. |
|
User Seeks per second |
User Seeks per second. |
|
User Scans per second |
User Scans per second |
|
User Lookups per second |
User Lookups per second |
|
User Updates per second |
User Updates per second |
|
System Seeks per second |
System Seeks per second |
|
System Scans per second |
System Scans per second |
|
System Lookups per second |
System Lookups per second |
|
System Updates per second |
System Updates per second |
|
Total Operations per second |
Total Operations per second |
1.37 Last Database Backup
The metrics in this category provide the last data or incremental backup information for all databases.
Default Collection Interval — Every 24 hours
Table 1-45 Last Database Backup Metrics
| Metric | Description |
|---|---|
|
Database_name (key column) |
Name of the database. |
|
Days Since Last Backup |
Date when the last data or incremental backup of the database was initiated. |
|
Last Backup Date |
Date when the last backup of the database was initiated. |
|
Last Backup Type |
Whether the last backup was a data (full) or incremental backup. |
1.38 Latches
The metrics in this category provide counters to monitor latches.
Evaluation and Collection Frequency — Every 15 Minutes
1.39 Latch Wait Time
The metrics in this category provide details about the average Latch Wait time.
Evaluation and Collection Frequency — Every 15 Minutes
1.40 Login
The MSSQL_Login class represents the login authentication records present in a SQL Server installation.
Default Collection Interval — in real time
1.41 Memory Manager
The Memory Manager object in Microsoft SQL Server provides counters that enable you to monitor overall server memory usage to gauge user activity and resource usage. This can help you identify performance bottlenecks.
1.41.1 For Microsoft SQL Server 2005/2008/2012
Default Collection Interval — Every 15 minutes
Table 1-49 Memory Manager Metrics
| Metric | Description |
|---|---|
|
Memory Manager Counter Name (key column) |
Performance metric name. See Table 1-50. |
|
Memory Manager Counter Value |
Performance metric value. |
The Memory Manager Counter Name key column contains several metrics. Table 1-50 provides a list of these metrics and a description for each.
Table 1-50 Memory Manager Counter Name Metrics
| Metric | Description |
|---|---|
|
Connection Memory (KB) |
Total amount of dynamic memory the server is using for maintaining connections. |
|
Granted Workspace Memory (KB) |
Total amount of memory currently granted to executing processes such as hash, sort, bulk copy, and index creation operations. |
|
Lock Memory (KB) |
Total amount of dynamic memory the server is using for locks. |
|
Lock Blocks Allocated |
Current number of allocated lock blocks. At server startup, the number of allocated lock blocks plus the number of allocated lock owner blocks depends on the SQL Server Locks configuration option. If more lock blocks are needed, the value increases. |
|
Lock Owner Blocks Allocated |
Current number of allocated lock owner blocks. At server startup, the number of allocated lock owner blocks plus the number of allocated lock blocks depends on the SQL Server Locks configuration option. If more lock owner blocks are needed, the value increases dynamically. |
|
Lock Blocks |
Current number of lock blocks in use on the server (refreshed periodically). A lock block represents an individual locked resource, such as a table, page, or row. |
|
Lock Owner Blocks |
Number of lock owner blocks currently in use on the server (refreshed periodically). A lock owner block represents the ownership of a lock on an object by an individual thread. Therefore, if three threads each have a shared (S) lock on a page, there will be three lock owner blocks. |
|
Maximum Workspace Memory (KB) |
Maximum amount of memory available for executing processes such as hash, sort, bulk copy, and index creation operations. |
|
Memory Grants Outstanding |
Total number of processes per second that have successfully acquired a workspace memory grant. |
|
Memory Grants Pending |
Total number of processes per second waiting for a workspace memory grant. |
|
Optimizer Memory (KB) |
Total amount of dynamic memory the server is using for query optimization. |
|
SQL Cache Memory (KB) |
Total amount of dynamic memory the server is using for the dynamic SQL cache. |
|
Target Server Memory (KB) |
Total amount of dynamic memory the server is willing to consume. |
|
Total Server Memory (KB) |
Memory allocated to the SQL Server. |
1.42 Memory Statistics
The metrics in this category provide information about various memory-related performance issues.
Default Collection Interval — Every 15 minutes
Table 1-51 Memory Statistics Metrics
| Metric | Description and User Action |
|---|---|
|
Average Latch Wait Time (ms) |
Average latch wait time in milliseconds for latch requests that had to wait. If this number is high, your server might have resource limitations. |
|
Buffer Cache Hit Ratio (%) |
Percentage of pages found in the buffer cache without having to read from disk. The ratio is the total number of cache hits divided by the total number of cache lookups since the SQL Server was started. After a long period of time, the ratio does not change very much. Because reading from the cache is much less expensive than reading from disk, this ratio should be high. Generally, you can increase the buffer cache hit ratio by increasing the amount of memory available to the SQL Server. |
|
Cache Hit Ratio (%) |
Percentage of pages found in the cache without needing to read from disk. The ratio is the total number of cache hits divided by the total number of cache lookups since the SQL Server was started. After a long period of time, the ratio does not change very much. Because reading from the cache is less expensive than reading from disk, this ratio should be high. The higher this value is, the better. Generally, you can increase the cache hit ratio by increasing the amount of memory available to the SQL Server. |
|
Log Flush Wait Time (ms) |
Log cache is very important, because it rolls back a transaction before it is committed if the circumstances warrant. But after a transaction is complete (and no longer can be rolled back), this log cache is immediately flushed to the physical log file. This is a normal procedure. SELECT queries that do not modify data do not create transactions and do not produce log flushes. Essentially, a log flush occurs when data is written from the log cache to the physical log file. Therefore, a log flush occurs every time a transaction completes, and the number of log flushes that occur are related to the number of transactions performed by the SQL Server. One way to troubleshoot the disk I/O bottleneck is to capture the Log Flushes/sec counter data and see how busy this mechanism is. If the server experiences a lot of transactions, it will also experience a lot of log flushes, so the value you see for this counter can vary from server to server, depending on how busy it is with action-type queries that create transactions. Try to identify situations where the number of log flushes per second seems to be significantly higher than the expected number of transactions that you think should be running on a server. |
|
Total Lock Wait Time (ms) |
Total wait time in milliseconds for locks in the last second. If the value is high, your server has high resource contention. |
1.43 Memory Usage
This metric category provides information about how much memory is used by the server.
Default Collection Interval — Every 15 minutes
1.44 Mirroring Monitoring
This metric category provides information about a database mirroring session. You must launch the Microsoft Database Mirroring Monitor tool before this metric category can collect data. Because of this requirement, this metric category is disabled by default.
Table 1-53 Mirroring Monitoring Metrics
| Metric | Description |
|---|---|
|
Database Name |
Name of the database. |
|
Mirroring Role |
Current role that the database plays in the database mirroring session. |
|
Mirroring State |
State of the mirror database and the database mirroring session. |
|
Witness Status |
Status of the witness in the database mirroring session. |
|
Log Generation Rate (KB) |
Rate of log generation in KB/s. |
|
Unsent Log (KB) |
Amount of unsent logs in KB. |
|
Send Rate (KB/s) |
Send rate in (KB/s) |
|
Unrestored Log (KB) |
Amount of unrestored logs in KB. |
|
Recovery Rate (KB/s) |
Recovery rate in KB/s |
|
Transaction Delay (ms) |
Length of a transaction delay in milliseconds |
|
Transactions per second |
Amount of transaction per second. |
|
Average Transaction Delay |
Average transaction delay. |
|
Mirroring Role Description |
Description of the mirroring role. |
|
Mirroring State Description |
Description of the mirroring state. |
|
Witness Status Description |
Description of the witness status. |
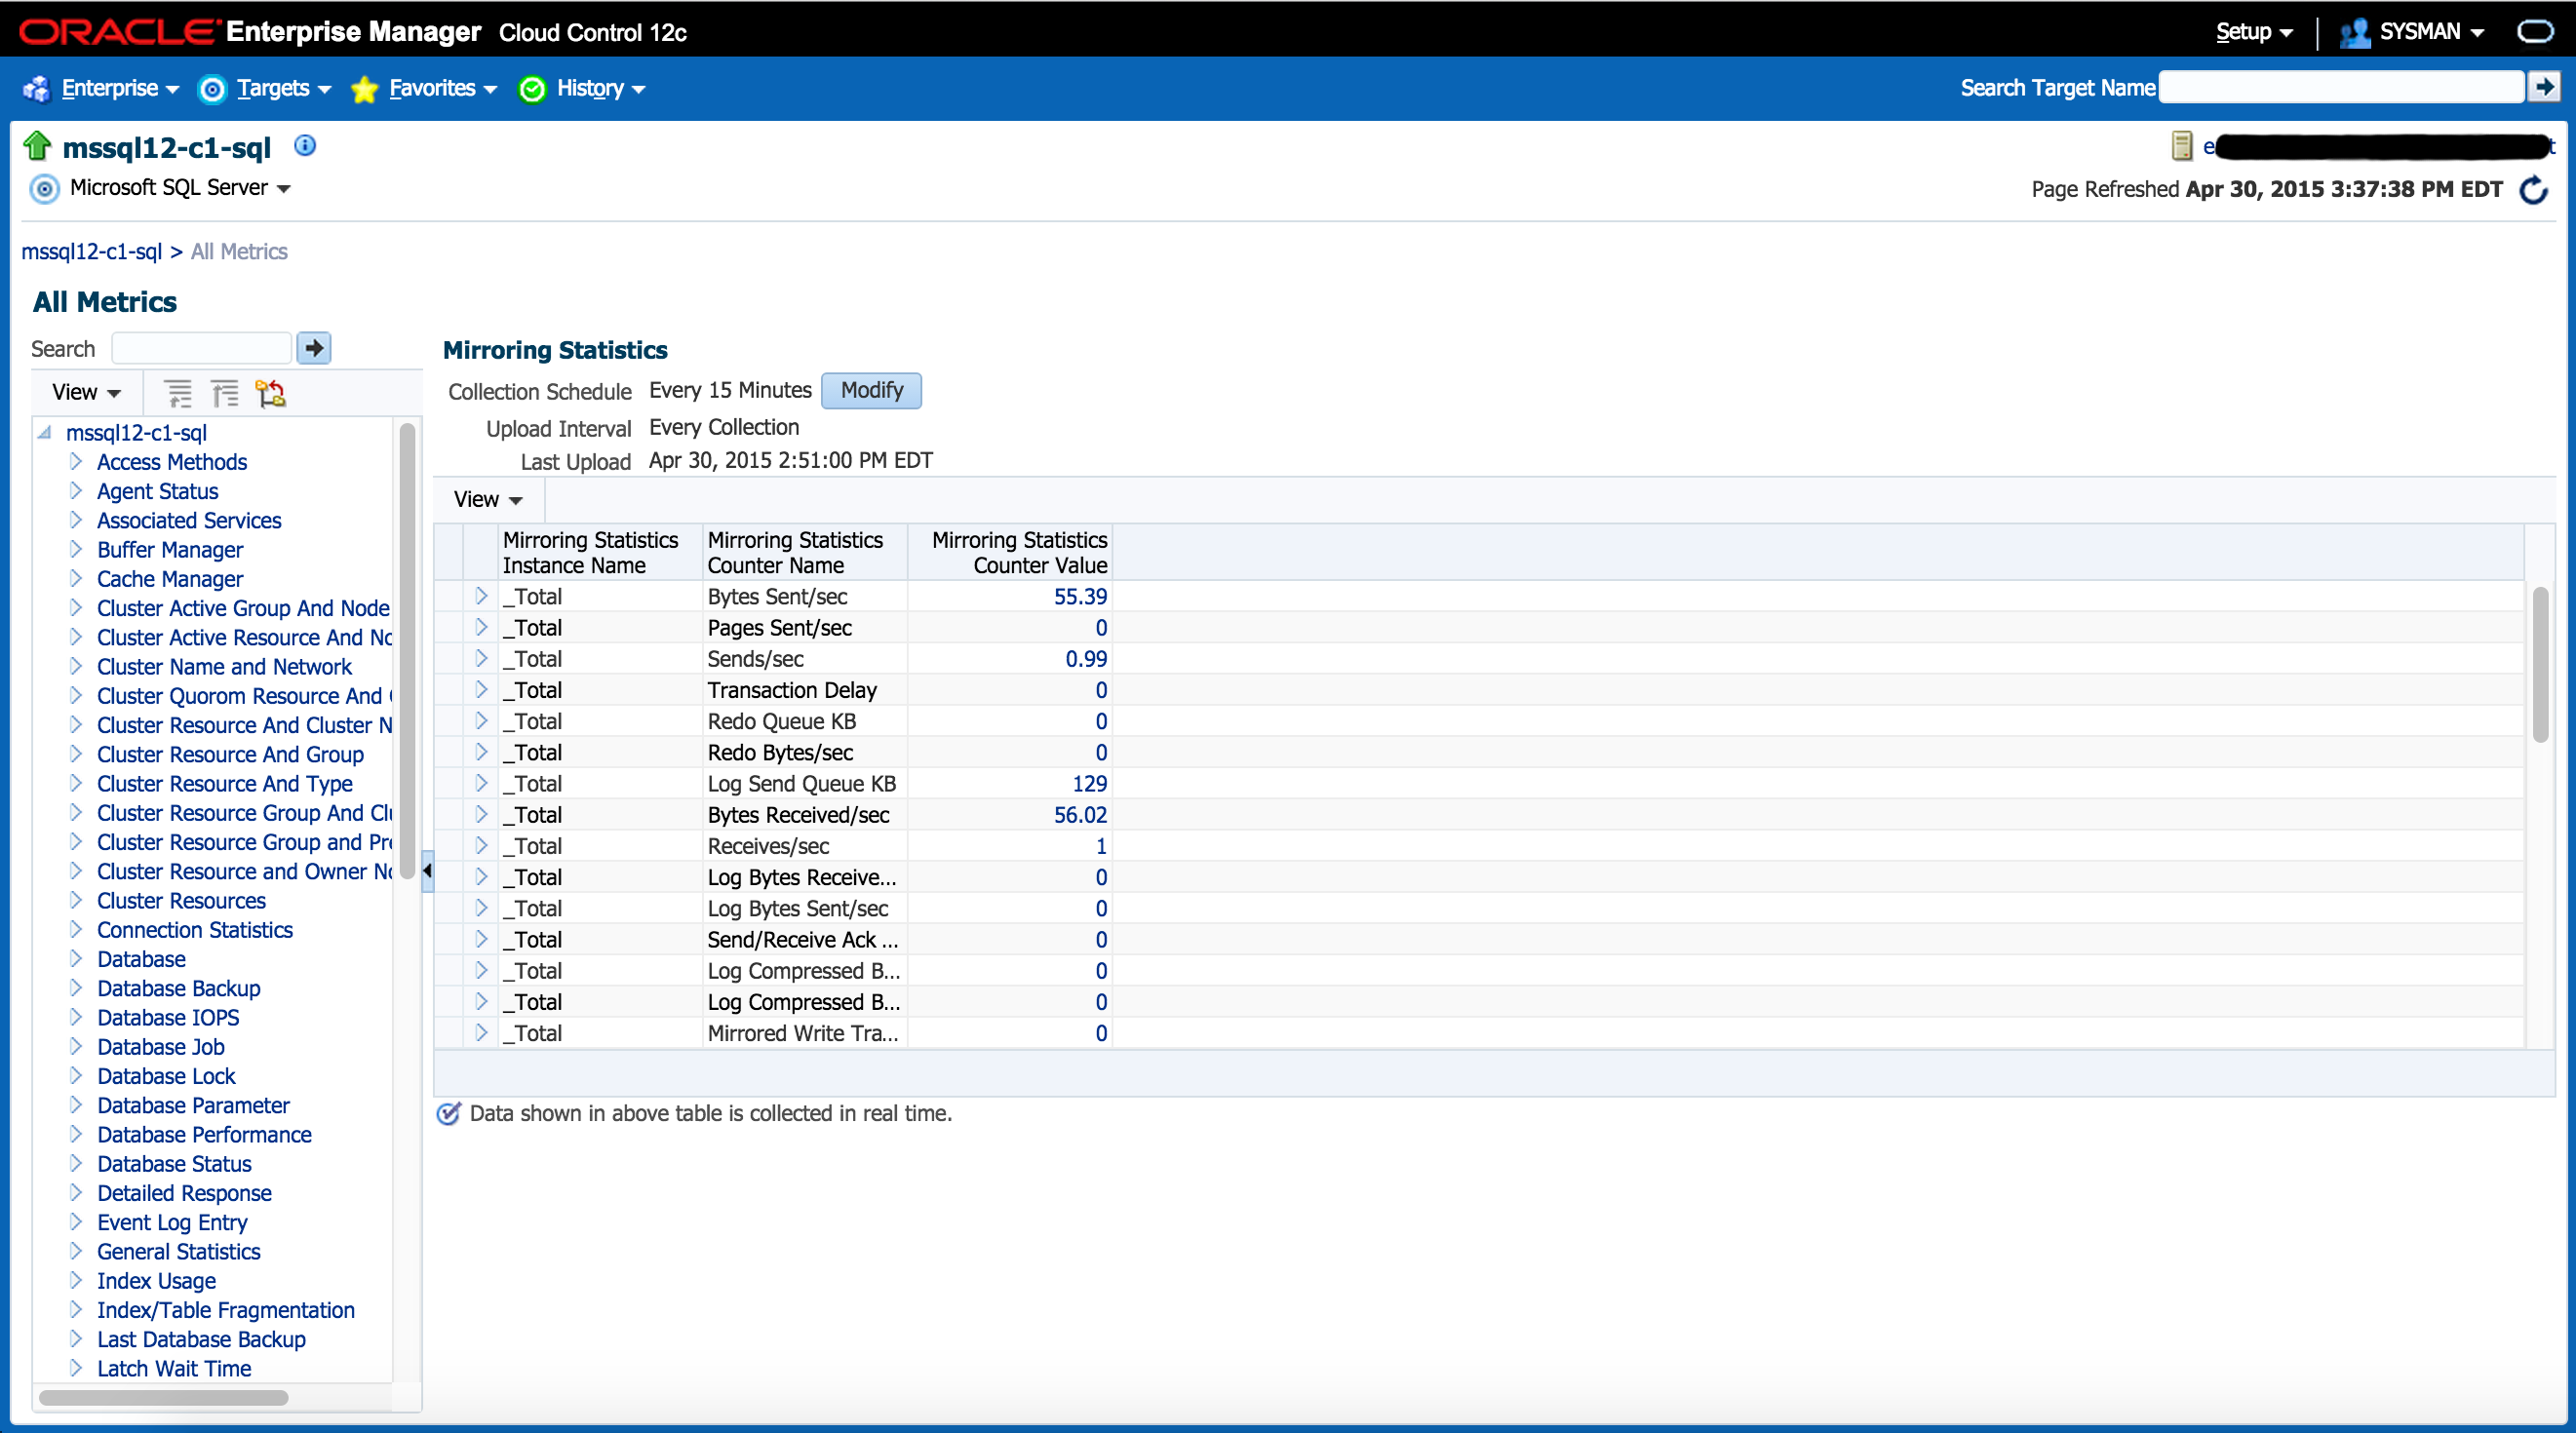
1.45 Mirroring Statistics
This metric category provides statistics about the mirroring session.
Default Collection Interval — Every 15 minutes
1.46 Missing Indexes
This metric category leverages MSSQL Dynamic Management Views to get recommended indexes.
Default Collection Interval — Every 60 minutes
Table 1-55 Missing Indexes Metrics
| Metric | Description |
|---|---|
|
Database Name |
Name of the database. |
|
Database ID |
Database identifier. |
|
Fully Qualified Table Name |
Available space for data file |
|
Table ID |
Table identifier. |
|
Equality Columns |
Columns that are queried when this index would be used. |
|
Inequality Columns |
Columns that are queried when this index would be used. |
|
Included Columns |
Columns often included in the result set when this index would be used. |
|
Unique Compiles |
Number of unique compiles. |
|
Last User Seek Time |
Time of the last user seek. |
|
Last User Scan Time |
Time of the last user scan. |
|
Last System Seek Time |
Time of the last system seek. |
|
Last System Scan Time |
Time of the last system scan. |
|
Estimated Performance Benefit |
Unitless measure of estimated benefit from this index. Useful only to compare to other recommended indexes. |
|
Generated Index Name |
Name generated based on table name and columns involved and included. |
|
User Seeks per second |
User Seeks per second |
|
User Scans per second |
User Scans per second |
|
System Seeks per second |
System Seeks per second |
|
System Scans per second |
System Scans per second |
1.47 MSSQL Database File
The MSSQL_DatabaseFile class is an extension to the CIM_DataFile class. It contains properties that are relevant to an operating system file that is also a file storing SQL Server database data.
Default Collection Interval — Every 30 minutes
Table 1-56 MSSQL Database File Metrics
| Metric | Description |
|---|---|
|
Database File Name (key column) |
User name. |
|
Database Name (key column) |
Name of the database. |
|
FileGroup Name (key column) |
Name of the File Group. |
|
Database File Path |
Complete path of the database file. |
|
Datafile Free Space (MB) |
Available space for data file |
|
Datafile Used Space (MB) |
Used space for data file |
|
File Growth |
Growth increment of the operating system file that stores table, index, or log data. When FileGrowthType is in megabytes, the FileGrowth value represents the number of megabytes of disk space to allocate for incremental file growth. When FileGrowthType is percent, the value represents a percentage and must be in the range from 1 through 100. |
|
File Growth Type |
Method of incremental allocation applied when an operating system file is extended.
|
|
Maximum Size |
Upper limit for the size of an operating system file containing table and index data, or maintaining a database transaction log. |
|
Normalized (for autogrowth) Maximum File Size (MB) |
Maximum file size of the database. |
|
Primary File |
Whether the database file is the one that maintains the database-specific system tables. A Microsoft SQL Server database can have only one primary file. |
|
Space Available in MB |
Amount of disk resources, in megabytes, allocated and unused in operating system files. |
|
Database File Space Available (%) |
Percentage of space available for the database file. If file autogrowth is enabled, the percentage of space available to the largest possible database file. |
|
Size (MB) |
Current size of the database file. |
1.48 MSSQL File Group
The MSSQL_FileGroup class represents the groups of operating system files that store a database. A SQL Server filegroup categorizes the operating system files containing data from a single SQL Server database to simplify database administration tasks, such as a backup. A filegroup cannot contain the operating system files of more than one database, though a single database can contain more than one filegroup.
Default Collection Interval — in real time
Table 1-57 MSSQL File Group Metrics
| Metric | Description |
|---|---|
|
DatabaseName (key column) |
Name of the database. |
|
Filegroup Name (key column) |
File Group name. |
|
Default |
Whether the file group is the default file group during table or index creation. |
|
File Group Free Space (MB) |
Available free space for file group. |
|
File Group Used Space (MB) |
Used space for file group. |
|
Read Only |
Whether the file group is read only. |
|
Total Size of the File Group (in MB) |
Total size of the file group in megabytes. |
|
Type |
File group type. A database is created on exactly one file group named PRIMARY. This is the primary file group. After database creation, you can add a file group to the database, called a user-defined file group.
|
1.49 MSSQL Transaction Log
Note:
This metric is supported for SQLServer Database 2000 targets but not for SQLServer Database 2005 targets.The MSSQL_TransactionLog class represents the transaction log of a Microsoft SQL Server database. A SQL Server transaction log maintains a record of modifications to the operating system files containing the data of an SQL Server database. The transaction log provides data recovery assistance if a system failure occurs, and a SQL Server database has at least one operating system file that stores transaction log records. A transaction log can be written to more than one operating system file. Each SQL Server database maintains its own transaction log, and the operating system file or files that store log records cannot be shared with another database.
Default Collection Interval — Every 30 minutes
Table 1-58 MSSQL Transaction Log Metrics
| Metric | Description |
|---|---|
|
Database Name (key column) |
FileGroup name. |
|
Size |
Initial size of the database. |
|
Last Backup |
Time of the last backup. |
|
Auto-growth Potential Space (MB) |
Amount of disk space available for the log to grow into based on its autogrowth settings. |
|
Transaction Log Space Available (%) |
Percentage of space available in the database. |
|
Unused Space (MB) |
Unused space in the database. |
1.50 Processor
The Win32_Processor class represents a device that is capable of interpreting a sequence of machine instructions on a Win32 computer system. On a multiprocessor machine, one instance of this class exists for each processor.
Default Collection Interval — Every 15 minutes
1.51 Response
This metrics category provide information about the response of the target SQL Server Instance.
Default Collection Interval — Every 5 minutes
| Metric | Description and User Action |
|---|---|
|
Process ID |
Process ID of the SQL Server process. |
|
Server Name |
Name of the instance of the SQL Server. |
|
Software Home |
Path of the SQL Server process. |
|
SQL Server Status |
Status of the SQL Server process. When the status is not Running, the SQL Server must be started. |
1.52 Server Statistics Metrics
The metrics in this category provide information about various server-related performance issues.
Default Collection Interval — Every 15 minutes
Table 1-61 Server Statistics Metrics
| Metric | Description |
|---|---|
|
CPU Busy Ratio |
CPU utilization. |
|
CPU ms |
CPU busy time in milliseconds. |
|
Errors / sec. |
Packet error rate in seconds. |
|
IDLE ms |
CPU idle time in milliseconds. |
|
IO ms |
IO busy time in milliseconds. |
|
Max Connections |
Maximum number of connections. |
|
Open Transactions |
Total number of transactions. |
|
Packet Error Ratio |
The ratio of erroneous packets received to the number of packets received. |
|
Packets Errors |
Number of packet errors. |
|
Packets Received |
Number of received packets. |
|
Packets Sent |
Number of sent packets. |
|
Reads / sec. |
Packet read rate in seconds. |
|
Total Errors |
Total number of errors. |
|
Total Reads |
Total number of reads. |
|
Total Writes |
Total number of writes. |
|
Writes / sec. |
Packet write rate in seconds. |
1.53 Space Usage
The metrics in this category provide information on how the space in each database is used.
Evaluation and Collection Frequency — Every 15 Minutes
Table 1-62 Space Usage Metrics
| Metric | Description |
|---|---|
|
Database Name |
Name of the database. |
|
Total Size of Database (MB) |
Total size of the database. |
|
Unallocated (MB) |
Amount of unallocated space in the database. |
|
Transaction Log Total Size (MB) |
Total size of the transaction log. |
|
Transaction Log Available (%) |
Percent of the transaction log available. |
|
Database File System Available (%) |
Percent of the file system available. |
|
Primary Filegroup Available (%) |
Percent of the primary filegroup available. |
|
Data (MB) |
Amount of space used by data. |
|
Indexes (MB) |
Amount of space used by indexes. |
|
Reserved but Unused (MB) |
Amount of space that is reserved, but not used yet. |
1.54 SQL Cluster Nodes Information
The metrics in this category provide details about the Windows cluster nodes.
Evaluation and Collection Frequency — Every 30 Minutes
1.55 SQL Cluster Number of Nodes
The metrics in this category provide the number of nodes in the cluster.
Evaluation and Collection Frequency — Every 30 Minutes
1.56 SQL Instance Statistics
This metric category provides statistics about the SQL instance.
Evaluation and Collection Frequency — Every 60 Minutes
1.57 SQL Server Process Statistics
The metrics in this category provide the number of nodes in the cluster.
Evaluation and Collection Frequency — Every 15 Minutes
1.58 SQL Server Backups
The metrics in this category provide a list of backups that can be restored or deleted through the plug-in job process.
Table 1-67 SQL Server Backups Metrics
| Metric | Description |
|---|---|
|
Backup File |
Backup file with full path. |
|
Server Name |
Server name. |
|
Database Name |
Name of database that has been backed up |
|
Backup Finish Date |
Backup finish date |
|
Backup Size (byte) |
File size of backup |
|
Backup Type |
Type of back up.
|
|
Media Set Id |
Media set ID |
|
File Position |
Position of database backup in backup file. |
|
Backup GUID |
Unique identifier for the backup. |
|
Differential Base GUID |
Unique identifier of the differential base. |
1.59 SQL Server Locks
The Locks object in Microsoft SQL Server provides information about SQL Server locks on individual resource types. Locks are held on SQL Server resources, such as rows read or modified during a transaction, to prevent concurrent use of resources by multiple transactions. For example, if an exclusive (X) lock is held on a row within a table by a transaction, no other transaction can modify that row until the lock is released. Minimizing locks increases concurrency, which can improve performance. Multiple instances of the Locks object can be monitored at the same time, with each instance representing a lock on a resource type.
1.59.1 For Microsoft SQL Server 2005/2008/2012
Default Collection Interval — Every 15 minutes
Table 1-68 SQL Server Locks Metrics
| Metric | Description |
|---|---|
|
SQL Server Locks Counter Name (key column) |
Performance metric name. See Table 1-69. |
|
SQL Server Locks Instance Name (key column) |
Instance for the SQL Server Locks Counter Name. |
|
SQL Server Locks Counter Value |
Performance metric value. |
The SQL Server Locks Counter Name key column contains several metrics. Table 1-69 provides a list of these metrics and a description for each.
Table 1-69 SQL Server Locks Counter Name Metrics
| Metric | Description |
|---|---|
|
Average Wait Time (ms) |
Average amount of wait time in milliseconds for each lock request that resulted in a wait. |
|
Average Wait Time Base |
Denominator ("base") of a fraction that the performance counter Average Wait Time ratio represents. |
|
Lock Requests/sec |
Number of new locks and lock conversions per second requested from the lock manager. |
|
Lock Timeouts/sec |
Number of lock requests per second that timed out, including internal requests for NOWAIT locks. |
|
Lock Waits/sec |
Number of lock requests per second that could not be satisfied immediately and required the caller to wait. |
|
Lock Wait Time (ms) |
Total wait time in milliseconds for locks in the last second. |
|
Number of Deadlocks/sec |
Number of lock requests per second that resulted in a deadlock. |
1.60 SQL Server Process
The MSSQL_Process class represents SQL Server processes. Note that these are not the same as an operating system's notion of a process. These are the processes identified by the SQL Server and assigned a SQL Server process ID by the SQL Server.
Default Collection Interval — Every 15 minutes
Table 1-70 SQL Server Process Metrics
| Metric | Description and User Action |
|---|---|
|
Process Handle (key column) |
Process ID. |
|
Blocked Process ID |
ID of a process being blocked by the process. |
|
CPU Time (ms) |
Cumulative CPU usage time of the process. |
|
Client Name |
Name of the client application. |
|
Command |
Abbreviated indicator of the current command. When no command is current, it has a value of AWAITING COMMAND. |
|
Creation Date |
Time that the process began executing. |
|
Database Name |
Database currently being used by the process. |
|
Execution State |
Current operating condition of the process. Possible values are as shown:
|
|
Host Name |
Name of the client workstation that started the SQL Server process. |
|
Login |
Login used by the process to connect to the SQL Server. |
|
Memory Usage (pages) |
Number of pages in the procedure cache that are currently allocated to this process. A negative number indicates that the process is freeing memory allocated by another process. |
|
Process State |
Whether the process is running or sleeping. |
|
OS Level Thread ID |
Identifier of the OS level thread. |
1.61 SQL Server Role
The MSSQL_Role class represents a database role or a SQL Server role. Roles establish groups of users with similar security attributes. Permissions can be granted by role, simplifying security planning and administration.
Default Collection Interval — Real Time
1.62 SQL Statistics
The SQL Statistics object in the Microsoft SQL Server provides counters to monitor compilation and the type of requests sent to an instance of the SQL Server. Monitoring the number of query compilations and recompilations and the number of batches received by an instance of the SQL Server indicates how quickly the SQL Server is processing user queries and how effectively the query optimizer is processing the queries.
1.62.1 For Microsoft SQL Server 2005/2008/2012
Default Collection Interval — Every 10 minutes
Table 1-72 SQL Statistics Metrics
| Metric | Description |
|---|---|
|
SQL Statistics Counter Name (key column) |
Performance metric name. See Table 1-73. |
|
SQL Statistics Counter Value (key column) |
Performance metric value. |
The SQL Statistics Counter Name key column contains several metrics. Table 1-73 provides a list of these metrics and a description for each.
Table 1-73 SQL Statistics Counter Name Metrics
| Metric | Description |
|---|---|
|
Auto-Param Attempts/sec |
Number of auto-parameterization attempts per second. Total should be the sum of the failed, safe, and unsafe auto-parameterizations. Auto-parameterization occurs when the SQL Server attempts to reuse a cached plan for a previously executed query that is similar as the current query, but not exactly the same. For more information, see "Auto-parameterization" in the Microsoft SQL Server Introduction. |
|
Batch Requests/sec |
Number of Transact-SQL command batches received per second. This statistic is affected by all constraints (such as I/O, number of users, cache size, complexity of requests, and so forth). High batch requests mean good throughput. For more information, see "Batch Processing" in the Microsoft SQL Server Introduction. |
|
Safe Auto-Params/sec |
Number of safe auto-parameterization attempts per second. |
|
SQL Compilations/sec |
Number of SQL compilations per second. Indicates the number of times the compile code path is entered. Includes compiles due to recompiles. After SQL Server user activity is stable, this value should reach a steady state. |
|
SQL Recompilations/sec |
Number of SQL recompiles per second. Counts the number of times recompiles are triggered. Generally, the number of recompiles should be low. |
|
Unsafe Auto-Params/sec |
Number of unsafe auto-parameterization attempts per second. The table has characteristics that prevent the cached plan from being shared. These are designated as unsafe. The fewer of these that occur the better. |
1.63 Top Queries by CPU Time Metrics
The metrics in this category provide details about the Top Queries by CPU Time.
Evaluation and Collection Frequency — Every 1 Hour
Table 1-74 Top Queries by CPU Time Metrics
| Metric | Description |
|---|---|
|
Query Hash (key) |
An MD5 hash of the query text. |
|
Query |
Text of the query. |
|
Total CPU Time (ms) |
Total amount of CPU time used by the query since the SQL Server service started. |
|
CPU Time (ms) per Hour |
Amount of CPU time used by the query per hour during the previous collection interval. |
1.64 Top Queries by Execution Count
The metrics in this category provide details about the top queries by execution count.
Evaluation and Collection Frequency — Every 1 Hour
Table 1-75 Top Queries by Execution Count Metrics
| Metric | Description |
|---|---|
|
Query Hash (key) |
An MD5 hash of the query text. |
|
Query |
Text of the query. |
|
Total Execution Count |
Number of times the query has executed since the SQL Server service started. |
|
Execution Count per Hour |
Number of times the query was executed per hour during the previous collection interval. |
1.65 Top Queries by Total Blocked Time
The metrics in this category provide details about the top queries by total blocked time.
Evaluation and Collection Frequency — Every 1 Hour
Table 1-76 Top Queries by Total Blocked Time Metrics
| Metric | Description |
|---|---|
|
Query Hash (key) |
An MD5 hash of the query text. |
|
Query |
Text of the query. |
|
Total Blocked Time (ms) |
Total amount of time the query has spent waiting for the CPU since the SQL Server service started. |
|
Blocked Time (ms) per Hour |
Amount of time the query spent waiting for the CPU per hour during the previous collection interval. |
1.66 Top Sessions by CPU Utilization
The metrics in this category provide details about the Top Sessions by CPU Utilization.
Evaluation and Collection Frequency — Every 1 Hour
Table 1-77 Top Queries by Top Sessions by CPU Utilization Metrics
| Metric | Description |
|---|---|
|
Session ID (key) |
SQL Server session ID. |
|
Login Name |
SQL Server login name. |
|
Login Time |
Time when the session was established |
|
Session Status |
Status of the session. |
|
Total CPU Time (ms) |
Total amount of CPU time used by the session since the SQL Server service started |
|
CPU Time (ms) per Hour |
Amount of CPU time used by the session per hour during the previous collection interval. |
1.67 Top Sessions by Memory Utilization
The metrics in this category provide details about the Top Sessions by Memory Utilization.
Evaluation and Collection Frequency — Every 1 Hour
Table 1-78 Top Sessions by Memory Utilization Metrics
| Metric | Description |
|---|---|
|
Session ID (key) |
SQL Server session ID. |
|
Login Name |
SQL Server login name. |
|
Login Time |
Time when the session was established. |
|
Session Status |
Time when the session was established. |
|
Memory Used (8 KB Pages) |
Number of memory pages being used by this session at the collection time.. |
1.68 User
The User object exposes the attributes of a single Microsoft SQL Server database user.
Default Collection Interval — Real Time
| Metric | Description and User Action |
|---|---|
|
DatabaseName (key column) |
Name of the database. |
|
Name (key column) |
User name. |
|
User Status |
The status property is a string indicating the current status of the object. Various operational and non-operational statuses can be defined. Operational statuses are OK, Degraded, and Pred Fail. Pred Fail indicates that an element may be functioning properly but predicting a failure in the near future. |
|
System Object |
The SystemObject property indicates whether the object is owned by Microsoft. A value of True indicates that the object implementation is owned by Microsoft. |
1.69 Windows Cluster Name
The metrics in this category provide details about the Windows cluster.
1.70 Windows Cluster Nodes
The metrics in this category provide details about Windows cluster nodes.