25 Monitoring a Coherence Cluster
After you have discovered the Coherence target and enabled the Management Pack Access, you can start monitoring the health and performance of the cluster. You can monitor the entire cluster or drill down to the various entities of the cluster like nodes, caches, services, proxies, and connections.
This chapter contains the following sections:
Before you start monitoring a cluster in Enterprise Manager, you must perform the following tasks:
-
Install the 12.1.0.4.0 Management Agent on all hosts where Coherence nodes are running.
-
Deploy the 12.1.0.6.0 Fusion Middleware Plug-in on all the Management Agents.
-
Verify that all Coherence MBeans are available in the Coherence JMX management node as described in the Section 24.3.1.3, "Testing the Configuration".
Note:
If the Management Agent is upgraded to 12.1.0.4.0, you must ensure that the Fusion Middleware Plug-in is also upgraded to 12.1.0.6.0.
25.1 Understanding the Page Layout
This section describes the layout of the Coherence pages in Enterprise Manager and how the pages can be customized. It contains the following sections:
-
Navigation Tree
-
Personalization
25.1.1 Navigation Tree
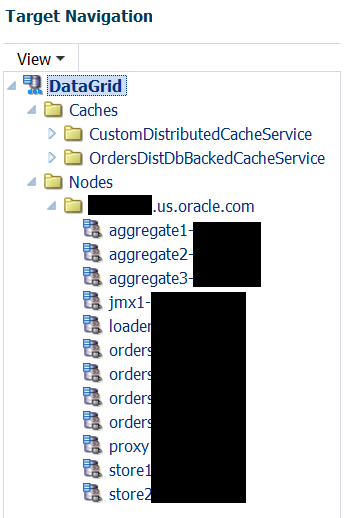
All Coherence pages in Enterprise Manager contain a navigation tree in the left panel of the page. The navigation tree displays all the entities in a selected cluster with the Cluster at the top level, followed by caches and nodes as the children entities. The entities are grouped as follows:
-
All caches that belong to a particular cluster are listed under the Caches folder in the navigation tree.
-
Cache targets of a service type are grouped together.
-
The Nodes folder contains host names on which the nodes are running as children entities.
-
Nodes that are running a particular host are grouped together.
You can expand or collapse any entity in the navigation tree by clicking on the Expand/Collapse icon. Click on an entity such as a node, cache, or service in the tree to view the associated home page on the right hand side. A snap shot of the navigation is shown below.
25.1.2 Personalization
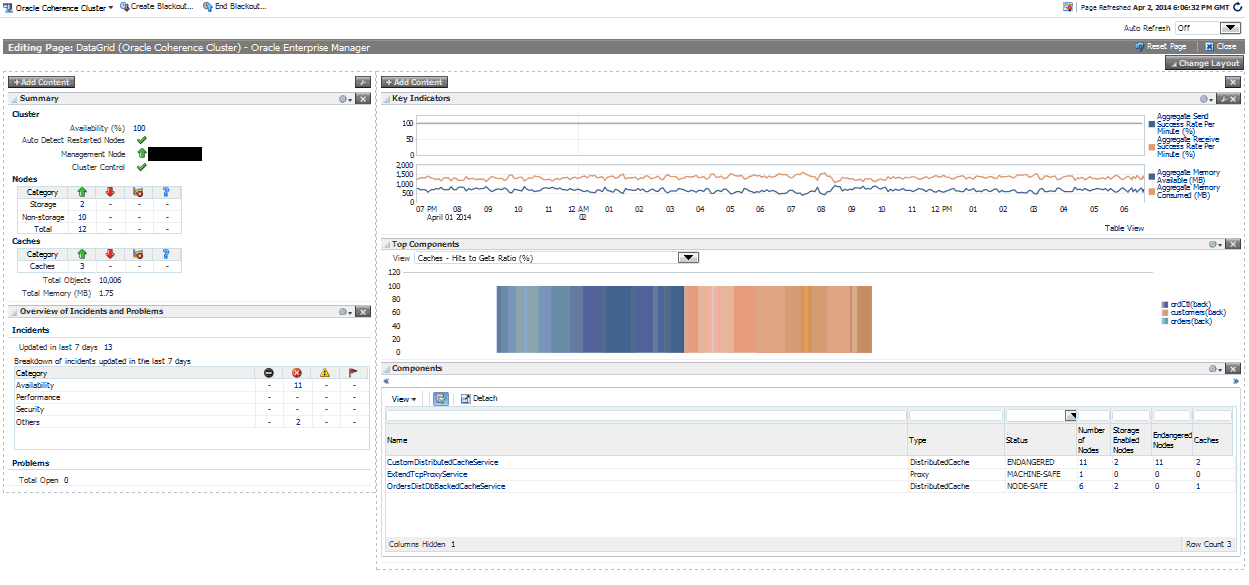
You can personalize any of the Coherence pages and select the regions to be displayed, the order in which they are displayed, the metrics to be included in the charts and so on. Click the Personalization icon on a page to view the page in Edit mode.
You will see the page in Edit mode as shown below.
In the Edit mode, you can do the following:
-
Change Layout: Click Change Layout and select a different layout for the page.
-
Add Content: Click Add Content. The regions that can be displayed on the page are displayed. Select a region, click Add, then click Close to return to the previous page.
-
Edit Regions: Click the Edit icon for a region to add or delete any parameters or metrics being displayed in the region.
-
Move Up / Move Down: You can change the location of a region on a page by using the Move Up / Down icon.
After you have made all the changes, click Close to apply the changes or click Reset Page to return to the default mode.
25.2 Home Pages
When you discover a Coherence cluster, a Coherence cluster target, caches, and properly configured nodes are created. Each of these entities collect a rich set of metrics. From the Home pages, you can view the overall cluster summary and key indicators from components such as nodes, caches, and services.
25.2.1 Coherence Cluster Home Page
Note:
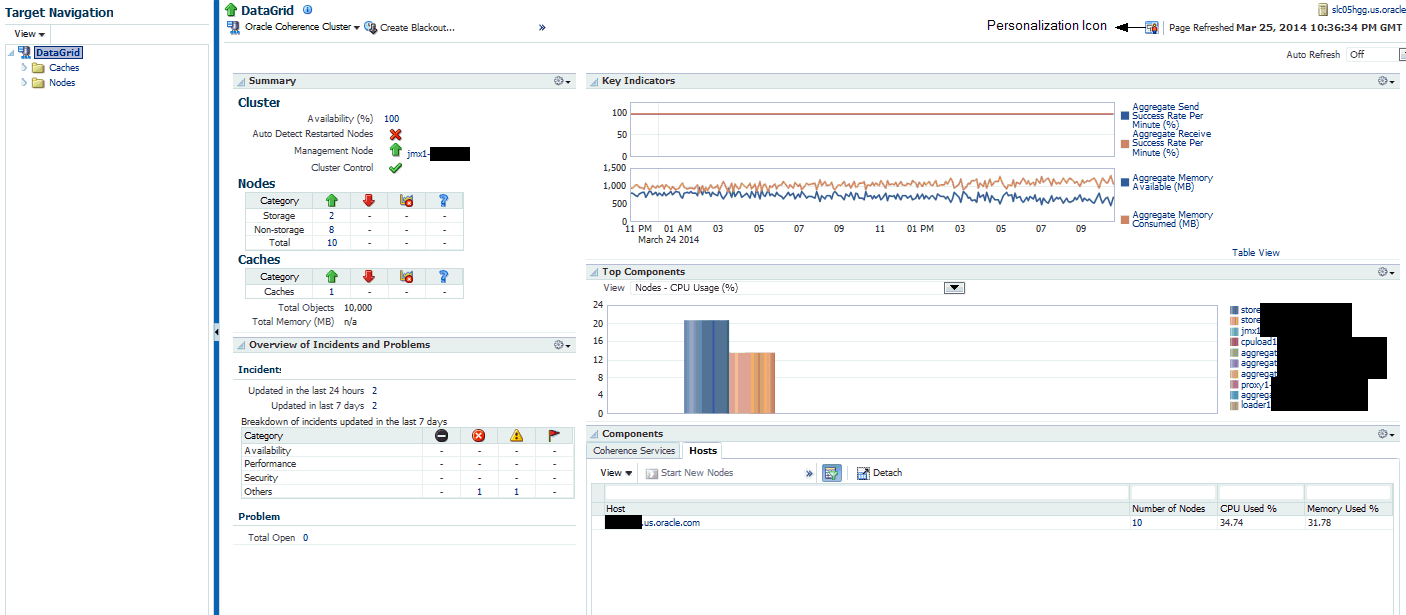
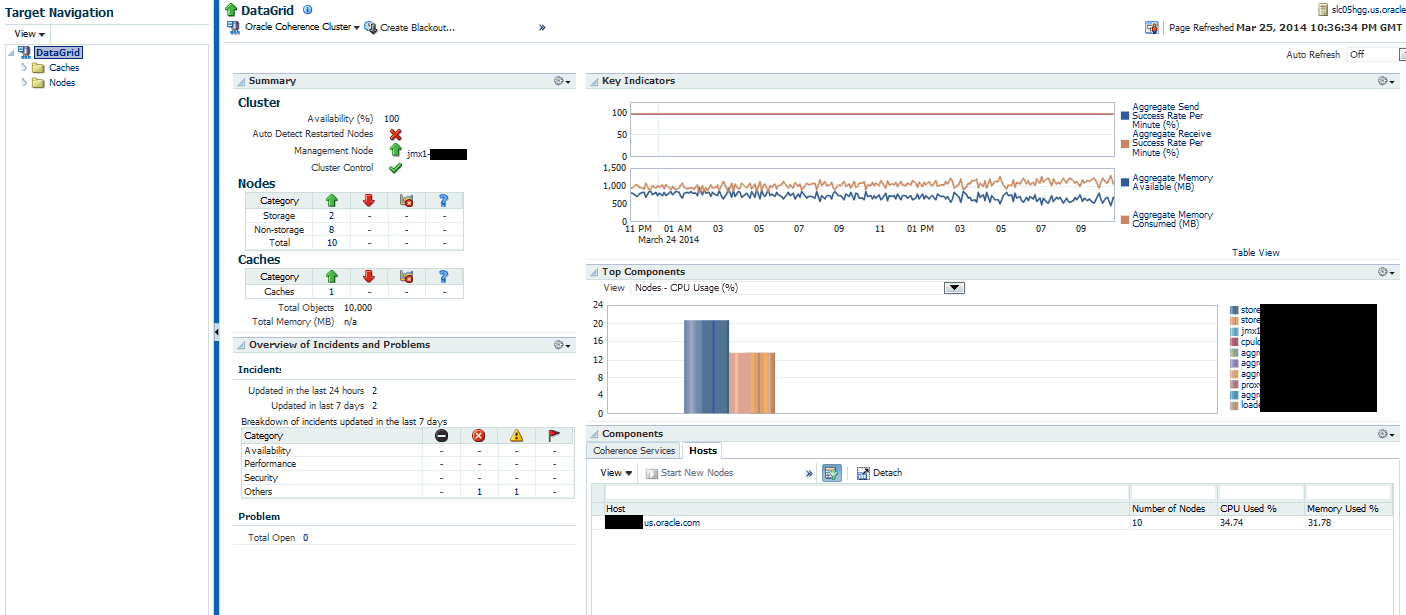
The data shown on this page is not real time data but is based on the latest data available from the OMS repository. After the Coherence cluster has been discovered, the most recent data is displayed only after the performance and configuration collection has been completed for the cluster and its members.To see a global view of the cluster, from the Targets menu, select Middleware, then click on a Coherence Cluster target. The Coherence Cluster Home page appears:
The following regions are displayed:
-
Summary: The following details are displayed:
-
Cluster
-
Availability (%): The availability of the cluster over the last 24 hours.
-
Auto Detect Restarted Nodes: If the cluster has been started with an extendedMBean property, the Auto Detect Restarted Nodes property is enabled and a check mark is displayed.
-
Management Node: Shows the name of the management node and its status. Click on the link to drill down to the Node Home page.
-
Cluster Control: Indicates if the Start / Stop feature is supported by this cluster. This flag is enabled if all the hosts on which the cluster is running are monitored by Enterprise Manager.
-
-
Nodes
-
-
Total Nodes: The total number of nodes in the cluster. Click on the link to drill down to the All Nodes page.
-
Storage Nodes: The number of storage enabled nodes in the cluster. Click on the link to drill down to the Storage Nodes page.
Note: The Number of Nodes and Storage Nodes listed here may be different from the number of node targets that have been discovered. As a result, when you click on the link, the number of nodes displayed may be lesser than the nodes shown in this table.
-
Non Storage Nodes: The nodes that are not storage enabled such as proxy, client nodes, and so on.
-
-
Caches
-
Caches: The total number of caches in the cluster. Click on the link to drill down to the All Caches page.
-
Total Objects: The total number of objects stored across all the back caches in the cluster.
-
Total Memory: The total memory in MB used by all the objects in the back caches. A numeric value is displayed only if a Binary calculator is used in cache configuration. If a Binary calculator is not used, a N/A will be displayed in this field.
-
-
-
Overview of Incidents and Problems: This region lists any incidents that have occurred over the last 7 days and any problems in the cluster and its associated targets (nodes, caches, and hosts). Click on the link to drill down to the Incident Manager page.
-
Key Indicators: This region displays graphs with key metrics that indicate the health and performance of the cluster. You can use the Personalization feature to specify the key metrics that are to be included in the charts.
-
Top Components: This region contains a graphical representation of the top 10 performing targets for a selected metric based on the latest available data from the OMS repository. The top components are listed in ascending or descending order depending on the metric selected and indicates how the top component data has been collected. Select a metric from the View drop down list to see a graphical representation of the top 10 targets for the selected metric. For example, if you select the Cache - Cache Objects metric, the graph displays the top 10 cache targets. Click on the graph or legend to drill down to the detail pages.
-
Components: This is a tabbed region with Coherence Services tab showing the Coherence Cluster Services and the Hosts table showing the list of hosts on which the cluster nodes are running. A detailed description of each tab is given below:
Coherence Service: This tab shows all the services in the Coherence cluster. It contains the following details.
-
Service Name: The unique name assigned to the service. Click on the link to drill down to the Service Home page.
-
Service Type: Some of the service types available are:
-
Cluster Service: This service is started when a cluster node needs to join the cluster. It keeps track of the membership and services in the cluster.
-
Distributed Cache Service: Allows cluster nodes to distribute (partition) data across the cluster so that each piece of data in the cache is managed (held) by only one cluster node.
-
Invocation Service: This service provides clustered invocation and supports grid-computing architectures
-
Replicated Cache Service: This is the synchronized replicated cache service, which fully replicates all of its data to all cluster nodes that are running the service.
-
-
Status: The high availability status of this service. This can be:
-
MACHINE-SAFE: This means that all the cluster nodes running on any given machine could be stopped at once without data loss.
-
NODE-SAFE: This means that any cluster node could be stopped without data loss.
-
ENDANGERED: This indicates that termination of any cluster node that runs this service may cause data loss.
Note: If new nodes that support a service are added to the cluster, the updated number is displayed only after the configuration collection has occurred.
If the Coherence cluster is running on an Exalogic rack, apart from the above, the following status types are available:
-
RACK-SAFE: This status indicates that a rack can be stopped without any data loss.
-
SITE-SAFE: This status indicates that a site can be stopped without any data loss.
-
-
Number of Nodes: The number of nodes in the service. Click on the link to drill down to the Node Performance page.
-
Storage Enabled Nodes: The number of storage enabled nodes for this service.
Note:
The Number of Nodes and Storage Enabled Nodes listed here may be different from the number of node targets that have been discovered. As a result, when you click on the link, the number of nodes displayed may be lesser than the nodes shown in this table. -
Endangered Nodes: Shows the number of endangered nodes for this service. Click on the link to drill down to the Node Performance page. Note: If new nodes have been added the cluster, the updated number is displayed only after the configuration collection has occurred.
-
Caches: The number of caches in the service. Click on the link to drill down to the Caches page.
-
Active Transactions: Transactional caches are specialized distributed caches that provide transactional guarantees. At run-time, transactional caches are automatically used together with a set of internal transactional caches that provide transactional storage and recovery. Transactional caches also allow default transaction behavior (including the default behavior of the internal transactional caches) to be overridden at run-time. The number of active transactions for this service is displayed here.
Hosts: This tab shows the hosts on which the nodes are running. It contains the following details:
-
Host: The host on which the node is present. The Host Name link is displayed if: only if the Machine Name property has been defined for the node.
-
The host on which the nodes are running is monitored by Enterprise Manager.
-
The name of the discovered host target must be the same as the name specified in the
oracle.coherence.machinesystem property.
-
-
Number of Nodes: The number of nodes present on each host. Click the link to drill-down to the Node Performance page.
-
CPU Used%: The percentage of CPU used on the host.
-
Memory Used%: The percentage of memory used on the host.
-
25.2.1.1 Cluster Management Operations
You can perform cluster management operations if you meet the following prerequisites:
-
The hosts on which the nodes are going to be started or stopped must be monitored targets in Enterprise Manager.
-
The Coherence nodes are started with the
-Doracle.coherence.machineJava option and the names match the host names monitored by Enterprise Manager. -
The Coherence nodes are started with
-Doracle.coherence.startscriptand-Doracle.coherence.homeJava options.The
oracle.coherence.startscriptoption specifies the absolute path to the start script needed to bring up a Coherence node. All customizations needed to start this node must be in this script. Theoracle.coherence.homeoption specifies the absolute path to the location in which the coherence folder is present which is$INSTALL_DIR/coherence. This folder contains Coherence binaries and libraries. -
Preferred Credentials have been setup for all hosts on which Cluster Management operations are to be performed.
The operations you can perform are:
-
Start New Nodes: You can start one or more nodes based on an existing node. The new node will have the same configuration as the existing node. You can start multiple nodes on multiple remote hosts in one operation. Select the hosts on which the new node is to be started and click Start New Nodes. You will see the Start New Nodes page where you can add one or more nodes.
-
Stop Nodes: You can stop all the nodes on a specific host. Select a host and click Stop Nodes. You will see the Stop Nodes page where the details of the nodes being stopped are displayed.
Note:
-
The Start New Nodes and Stop Nodes options will be available only if the hosts on which the nodes are running are monitored by Enterprise Manager. An asterisk indicates hosts that are not monitored by Enterprise Manager.
-
Information about a newly started node is uploaded into the repository only after one regular agent metric collection i.e. by default value of 5 minutes.
-
25.2.1.2 Cluster Menu Navigation
The following key menu options are available from the Coherence Cluster Home menu:
-
Viewing The Performance Summary: From the Oracle Coherence Cluster menu, select Monitoring, then select Performance Summary. You can view the performance of the cluster on this page. See Section 25.4.1, "Performance Summary Page" for details.
-
Metric and Collection Settings: From the Oracle Coherence Cluster menu, select Monitoring, then select Metric and Collection Settings. You can set up corrective actions to add nodes and caches as Enterprise Manager targets.
-
You can navigate to the following pages:
-
Nodes
-
Caches
-
Services
-
Applications
-
Proxies
-
-
Cluster Administration: From the Oracle Coherence Cluster menu, select Administration. See Section 26.1, "Cluster Administration Page" for details.
-
Refresh Cluster: From the Oracle Coherence Cluster menu, select Refresh Cluster. You can refresh a cluster to synchronize Coherence targets in Enterprise Manager with a running cluster.
-
Coherence Node Provisioning: From the Oracle Coherence Cluster menu, select Coherence Node Provisioning. You can deploy a Coherence node across multiple targets in a farm. See Enterprise Manager Lifecycle Management Administrator's Guide for more details on Coherence Node Provisioning.
-
Last Collected Configuration: From the Oracle Coherence Cluster menu, select Configuration, then select Last Collected. You can view the latest or saved configuration data for the Coherence cluster.
-
Topology: From the Oracle Coherence Cluster menu, select Configuration, then select Topology. The Configuration Topology Viewer provides a visual layout of the Coherence deployment and shows the Coherence cluster and its associated nodes and caches.
-
JVM Diagnostics: From the Oracle Coherence Cluster menu, select JVM Diagnostics to view the Coherence Cluster JVM Diagnostics Pool Drill Down page. This option is available only if the cluster has been configured for JVM Diagnostics and the WLS Management Pack EE Management Pack has been included. See Section 28, "Coherence Integration with JVM Diagnostics" for details.
25.2.2 Node Home Page
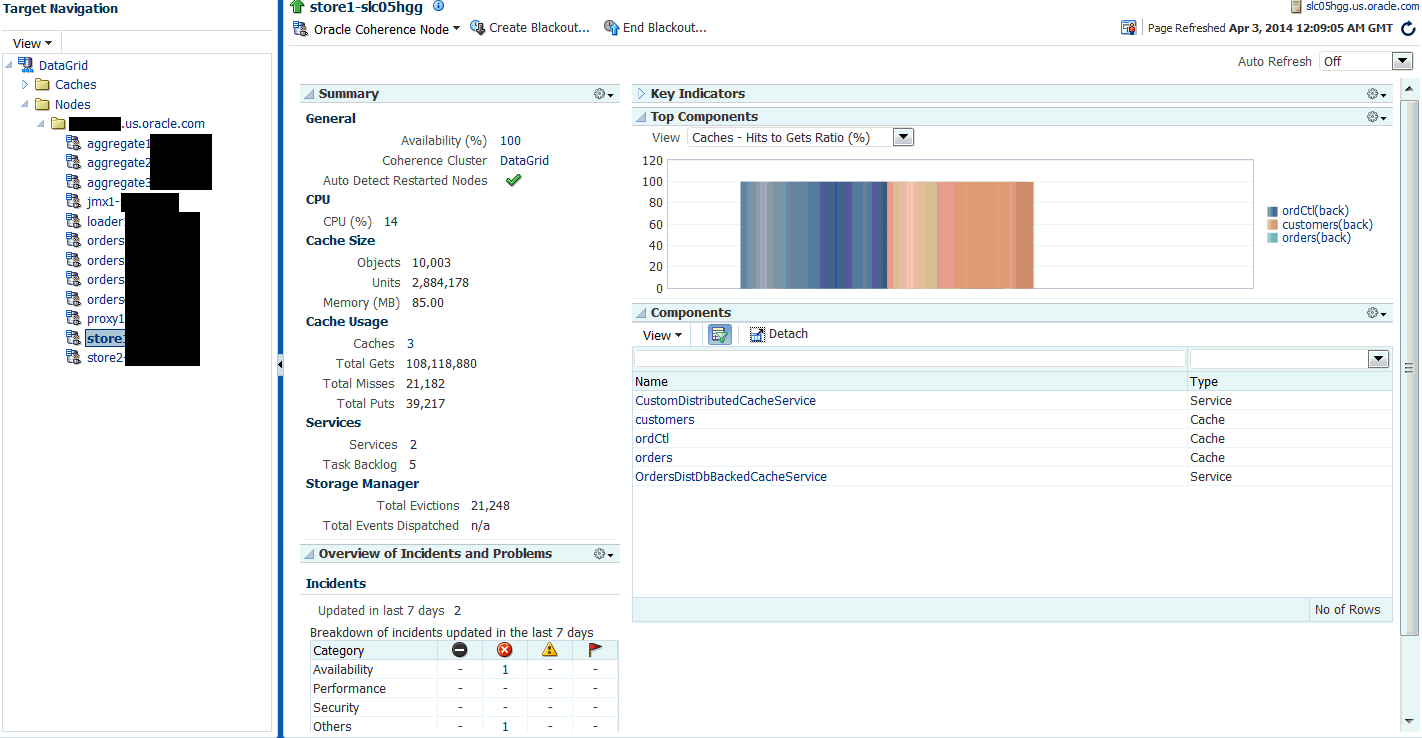
This page provides details of a selected node in the cluster.
It contains the following regions:
-
Summary
-
General
-
Availability: The availability of the node over the last 24 hours.
-
Coherence Cluster: The cluster with which this node is associated.
-
Auto Detect Restarted Nodes: If the node has been started with an extendedMBean flag, this flag is enabled and a check mark is displayed.
-
-
CPU
-
CPU (%): The CPU percentage used.
-
-
Cache Size
-
Objects: The aggregate number of objects in the cache.
-
Units: The aggregate number of units in the cache.
-
Memory: The aggregate memory used by the cache.
-
-
Cache Usage
-
Caches: The total number of caches in the cluster.
-
Total Gets: The total number of get() operations over the last 24 hours.
-
Total Misses: The total number of cache misses in the last 24 hours.
-
Total Puts: The total number of put() operations over the last 24 hours.
-
-
Services
-
Services: The total number of services running on the cache.
-
Task Backlog: The size of the backlog queue that holds tasks scheduled to be executed by one of the service pool threads.
-
-
Storage Manager
-
Total Evictions: The total number of evictions from the backing map managed by this Storage Manager.
-
Total Events Dispatched: The total number of events dispatched by the Storage Manager per minute.
-
-
-
Overview of Incidents and Problems
This region lists any incidents that have occurred over the last 7 days and any problems in the node and its associated host target. Click on the link to drill down to the Incident Manager page.
-
Key Indicators
This region displays graphs with key metrics that indicate the health and performance of the node over the last 24 hours. You can customize the metrics specify the key metrics that are to be included in the charts by selecting them from the metric palette.
-
Top Components
This region contains a graphical representation of the top 10 performing targets for a selected metric from the last metric collection. The graph does not display real time data. The top components are listed in ascending or descending order depending on the metric selected and indicates how the top component data has been collected. Select a metric from the View drop down list to see a graphical representation of the top 10 targets for the selected metric. For example, if you select the Cache - Cache Objects metric, the graph displays the top 10 cache targets.
-
Components
This region lists the components associated with the node such as caches, services, connections, connection managers, and applications. the cluster. The table displays the name and type of the component.
25.2.2.1 Node Menu Navigation
The following key menu options are available from the Oracle Coherence Node Home page:
-
Viewing The Performance Summary: From the Oracle Coherence Node menu, select Monitoring, then select Performance Summary. You can view the performance of the cluster on this page. See Section 25.4.1, "Performance Summary Page" for details.
-
Metric and Collection Settings: From the Oracle Coherence Node menu, select Monitoring, then select Metric and Collection Settings. You can set up corrective actions to add nodes and caches as Enterprise Manager targets.
-
You can navigate to the following pages:
-
Caches
-
Services
-
-
Administration: From the Oracle Coherence Node menu, select Administration. See Section 26.2, "Node Administration Page" for details.
-
Last Collected Configuration: From the Oracle Coherence Node menu, select Configuration, then select Last Collected. You can view the latest or saved configuration data for the Coherence cluster.
-
Topology: From the Oracle Coherence Node menu, select Configuration, then select Topology. The Configuration Topology Viewer provides a visual layout of the Coherence deployment and shows the Coherence cluster and its associated nodes and caches.
-
JVM Diagnostics: From the Oracle Coherence Node menu, select JVM Diagnostics to view the Coherence Node JVM Pool Drill Down page. This option is available only if the node has been configured for JVM Diagnostics and the WLS Management Pack EE Management Pack has been included. See Section 28, "Coherence Integration with JVM Diagnostics" for details.
25.2.3 Cache Home Page
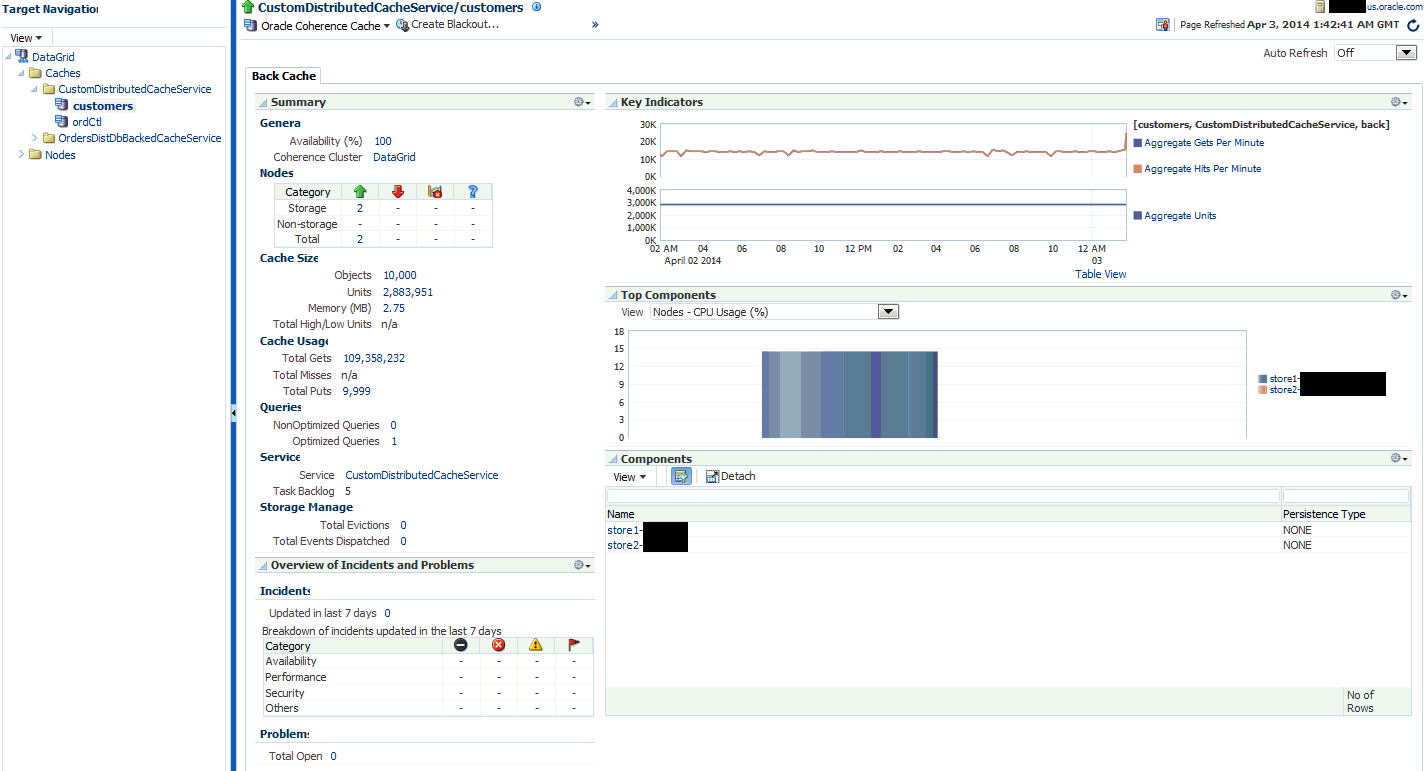
This page provides detailed information of a selected cache.
It contains the following regions:
-
Summary
-
General
-
Availability: The availability of the cache over the last 24 hours.
-
Coherence Cluster: The cluster with which this cache is associated.
-
-
Nodes
-
Total Nodes: The total number of nodes in the cluster. Click on the link to drill down to the All Nodes page.
-
Storage Nodes: The number of storage enabled nodes in the cluster. Click on the link to drill down to the Storage Nodes page.
Note:
New storage enabled nodes are not automatically added to the cluster. You must refresh the cluster to add node targets for physical nodes added to cluster. -
Non Storage Nodes: The nodes that are not storage enabled such as proxy, client nodes, and so on. These are relevant for front caches only. See Section 25.2.3.1, "Near Cache" for details.
-
-
Cache Size:
-
Objects: The aggregate number of objects in the cache.
-
Units: The aggregate number of units in the cache.
-
Memory: The aggregate memory used by the cache.
-
Total High / Low Units: This represents the high and low units configured for the cache. If this parameter has not been configured, an n/a will be displayed.
-
-
Cache Usage
-
Total Gets: The aggregate number of get operations across all nodes supporting this cache in the last 24 hours.
-
Total Misses: The aggregate number of cache misses across all nodes supporting this cache in the last 24 hours.
-
Total Puts: The aggregate number of put operations across all nodes supporting this cache in the last 24 hours.
-
-
Queries
-
Non Optimized Queries: The total execution time, in milliseconds for queries that could not be resolved per minute.
-
Optimized Queries: The total number of parallel queries that were fully resolved using indexes per minute.
-
-
Service
-
Service: The service supporting this cache.
-
Task Backlog: The size of the backlog queue that holds tasks scheduled to be executed across all services.
-
-
Storage Manager (These metrics are applicable only for Back caches.)
-
Total Evictions: The aggregate number of evictions from the backing map managed by this Storage Manager.
-
Total Events Dispatched: The total number of events dispatched by the Storage Manager per minute.
-
-
-
Overview of Incidents and Problems
This region lists any incidents that have occurred over the last 7 days and any problems in the node and its associated host target. Click on the link to drill down to the Incident Manager page.
-
Key Indicators
This region displays graphs with key metrics that indicate the health and performance of the node over the last 24 hours. You can customize the metrics that are charted by selecting them from metric palette.
-
Top Components
This region contains a graphical representation of the top 10 performing targets for a selected metric from the last configuration collection. The top components are listed in ascending or descending order depending on the metric selected and indicates how the top component data has been collected. Select a metric from the View drop down list to see a graphical representation of the top 10 targets for the selected metric. For example, if you select the Cache - Cache Objects metric, the graph displays the top 10 cache targets.
-
Components
This region lists the nodes with which the cache is associated. Click on the Name link to drill down to the Node Home page.
25.2.3.1 Near Cache
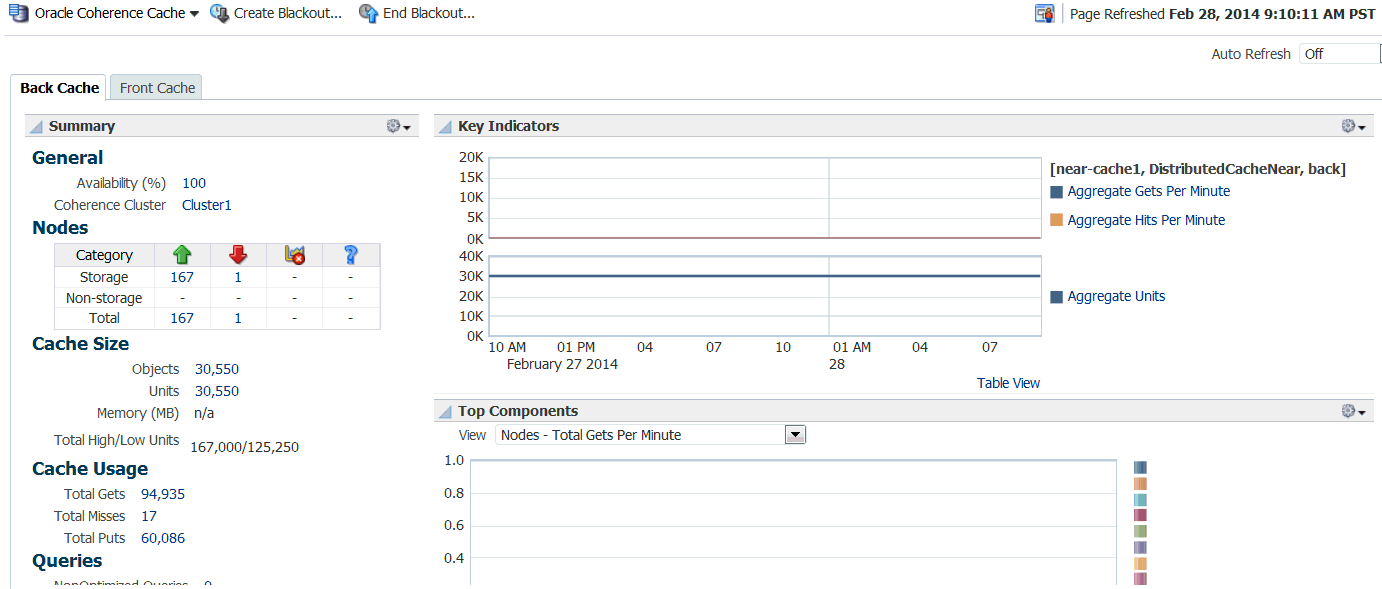
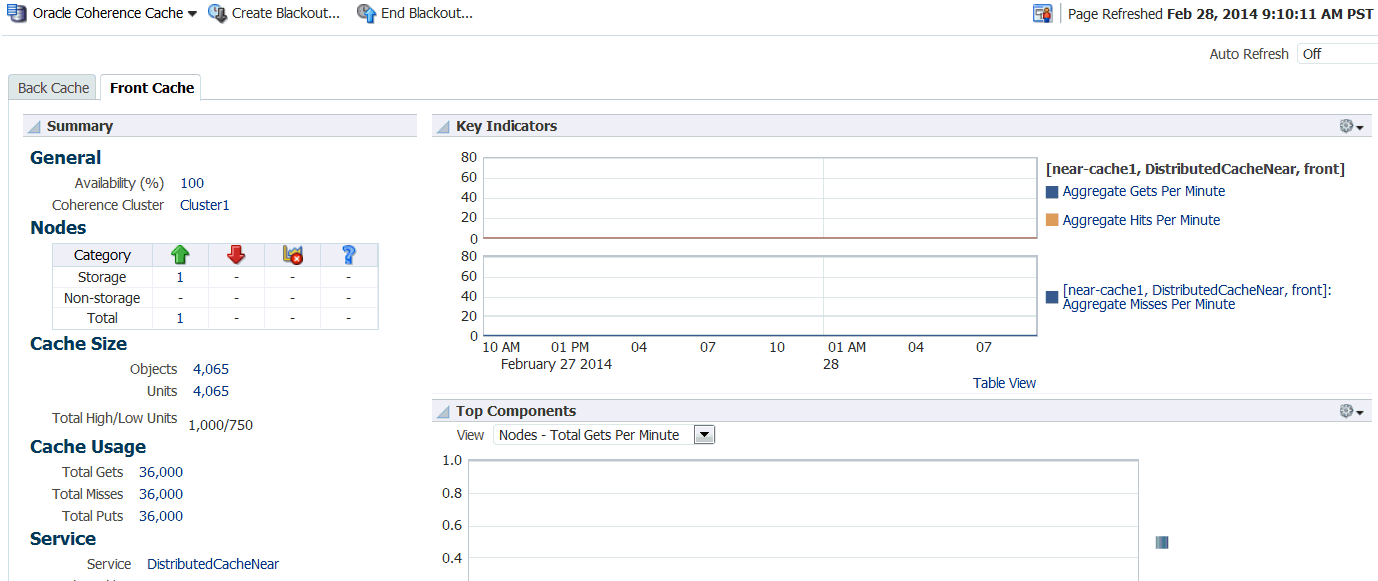
A near cache is a hybrid cache; it typically fronts a distributed cache or a remote cache with a local cache. A near cache invalidates front cache entries, using a configured invalidation strategy, and provides excellent performance and synchronization. Near cache backed by a partitioned cache offers zero-millisecond local access for repeat data access, while enabling concurrency and ensuring coherency and fail over, effectively combining the best attributes of replicated and partitioned caches.
The objective of a near cache is to provide the best of both worlds between the extreme performance of the Replicated Cache and the extreme scalability of the Distributed Cache by providing fast read access to Most Recently Used (MRU) and Most Frequently Used (MFU) data. Therefore, the near cache is an implementation that wraps two caches: a "front cache" and a "back cache" that automatically and transparently communicate with each other by using a read-through/write-through approach.The "front cache" provides local cache access. It is assumed to be inexpensive, in that it is fast, and is limited in terms of size. The "back cache" can be a centralized or multitiered cache that can load-on-demand in case of local cache misses. The "back cache" is assumed to be complete and correct in that it has much higher capacity, but more expensive in terms of access speed.
If a near cache is present in the cluster, you will see a tabbed Cache Home, one for each of back and front caches respectively.
25.2.3.2 Cache Menu Navigation
The following key menu options are available from the Coherence Cache Home page:
-
Viewing The Performance Summary: From the Oracle Coherence Cache menu, select Monitoring, then select Performance Summary. You can view the performance of the cluster on this page. See Section 25.4.1, "Performance Summary Page" for details.
-
Metric and Collection Settings: From the Oracle Coherence Cache menu, select Monitoring, then select Metric and Collection Settings. You can set up corrective actions to add nodes and caches as Enterprise Manager targets.
-
You can navigate to the following pages:
-
Nodes
-
Services
-
-
Administration: From the Oracle Coherence Cache menu, select Administration. See Section 26.3, "Cache Administration Page" for details.
-
Cache Data Management: The Cache Data Management feature allows you to define indexes and perform queries against currently cached data that meets a specified set of criteria. See Section 26.5, "Cache Data Management" for details.
-
Last Collected Configuration: From the Oracle Coherence Cluster menu, select Configuration, then select Last Collected. You can view the latest or saved configuration data for the Coherence cluster.
-
Topology: From the Oracle Coherence Cluster menu, select Configuration, then select Topology. The Configuration Topology Viewer provides a visual layout of the Coherence deployment and shows the Coherence cluster and its associated nodes and caches.
-
JVM Diagnostics: From the Oracle Coherence Cache menu, select JVM Diagnostics to view the Coherence Cache JVM Diagnostics Pool Drill Down page. This option is available only if the cluster has been configured for JVM Diagnostics and the WLS Management Pack EE Management Pack has been included. See Section 28, "Coherence Integration with JVM Diagnostics" for details.
25.2.4 Application Home Page
This page allows you to view and monitor the application data stored in various types of caches. To view this page, select the Applications option from the Oracle Coherence Cluster menu.
If an application contains multiple web modules, the application data for each module is displayed. Click Reset Statistics to reset the session management statistics.
The following graphs are displayed:
-
Local Attribute Count: Shows the local attribute count.
-
Local Session Count: Shows the local session count.
-
Overflow Updates: Shows the number of overflow updates per minute.
-
Session Updates: Shows the number of session updates per minute
-
Reap Duration: Shows the average reap duration in milliseconds.
-
Reap Session: Shows the average number of reaped sessions in a reap cycle.
Overflow Cache
This table contains the following details:
-
Module: The name of the Coherence cluster with the application.
-
Node ID: This is the node target name. Click on the link to drill down to the Node Home page.
-
Cache: This is the name of the cache target. Click on the link to drill down to the Cache Home page.
-
Average Size: The average size (in bytes) of a session object placed in the session storage clustered cache since the last time statistics were reset.
-
Max Size: The maximum size (in bytes) of a session object placed in the session storage clustered cache since the last time statistics were reset.
-
Threshold: The minimum length (in bytes) that the serialized form of an attribute value must be in order for that attribute value to be stored in the separate "overflow" cache that is reserved for large attributes.
-
Overflow Updates: The number of updates to session attributes stored in the "overflow" clustered cache since the last time statistics were reset.
Clustered Session Cache
-
Module: The name of the Coherence cluster with the application.
-
Node ID: This is the node target name. Click on the link to drill down to the Node Home page.
-
Cache: This is the name of the cache target. Click on the link to drill down to the Cache Home page.
-
Average Size: The average size (in bytes) of a session object placed in the session storage clustered cache since the last time statistics were reset.
-
Min Size: The minimum size (in bytes) of a session object placed in the session storage clustered cache since the last time statistics were reset.
-
Max Size: The maximum size (in bytes) of a session object placed in the session storage clustered cache since the last time statistics were reset.
-
Session ID Length: The length of the generated session IDs.
-
Timeout: The session expiration time (in seconds) or -1 if sessions never expire.
-
Session Updates: The number of updates of session objects stored in the session storage clustered cache per minute.
-
Pinned Objects: The number of session objects that are pinned to this instance of the web application or -1 if sticky session optimizations are disabled.
Reaped Sessions
-
Module: The name of the Coherence cluster with the application.
-
Node ID: This is the name of the node target. Click on the link to drill down to the Node Home page.
-
Average Reap Duration: The average reap duration in minutes.
-
Average Reaped Sessions: The average number of reap sessions since the statistics were last reset.
-
Total Reaped Sessions: The total number of expired sessions that have been reaped since the statistics were last reset.
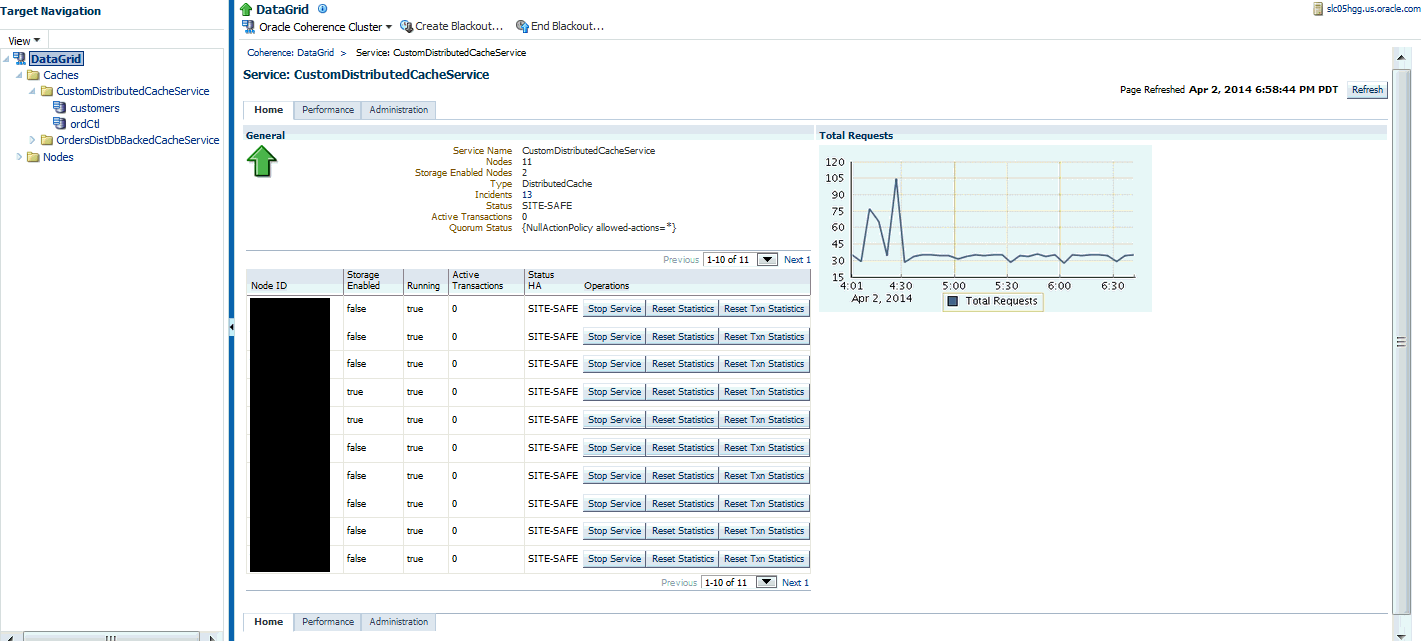
25.2.5 Service Home Page
This page shows all the details of a service in a coherence cluster.
It contains the following regions:
-
Name: The name assigned to the service.
-
Nodes: The number of nodes in the service.
-
Storage Enabled Nodes: The number of storage enabled nodes supporting this service.
-
Type: Some of the service types available are:
-
Cluster Service: This service is started when a cluster node needs to join the cluster. It keeps track of the membership and services in the cluster.
-
Distributed Cache Service: Allows cluster nodes to distribute (partition) data across the cluster so that each piece of data in the cache is managed (held) by only one cluster node.
-
Invocation Service: This service provides clustered invocation and supports grid-computing architecture.
-
Replicated Cache Service: This is the synchronized replicated cache service, which fully replicates all of its data to all cluster nodes that are running the service.
-
-
Incidents: Any incidents or problems that have occurred. Click on the link to drill down to the Incident Manager page.
-
Status: The High Availability status for this service. This can be:
-
MACHINE-SAFE: This means that all the cluster nodes running on any given machine could be stopped at once without data loss.
-
NODE-SAFE: This means that any cluster node could be stopped without data loss.
-
ENDANGERED: This indicates that abnormal termination of any cluster node that runs this service may cause data loss.
-
RACK-SAFE: This status indicates that a rack can be stopped without any data loss.
-
SITE-SAFE: This status indicates that a site can be stopped without any data loss.
-
-
Active Transactions: The total number of currently active transactions. An active transaction is counted as any transaction that contains at least one modified entry and has yet to be committed or rolled back. Note that the count is maintained at the coordinator node for the transaction, even though multiple nodes may have participated in the transaction.
Total Requests
This graph shows the total number of synchronous requests issued by the service since the last collection interval.
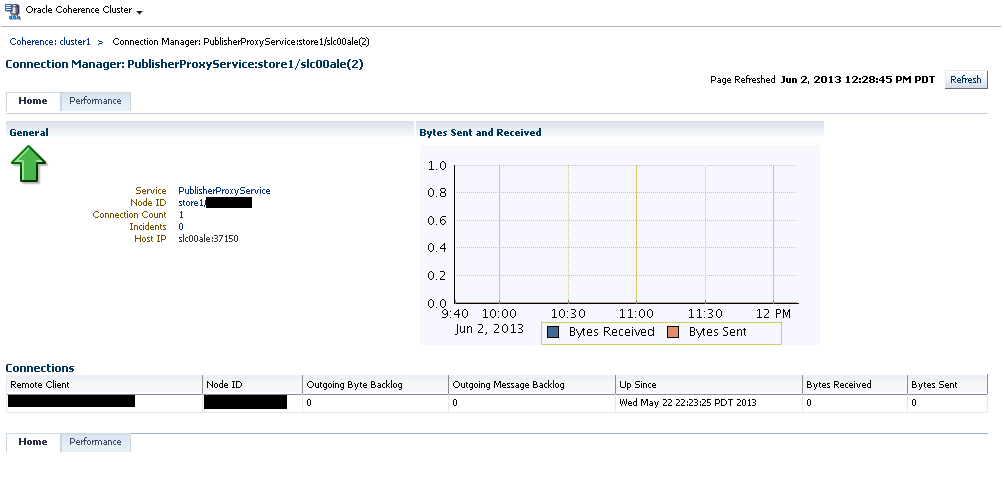
25.2.6 Connection Manager Home Page
Use this page to view the Connection Manager details in the Coherence cluster.
This page contains the following sections:
-
General
-
Service Name: The unique name assigned to the service.
-
Node ID: This is the node target name.
-
Connection Count: The number of connections associated with the connection manager instance.
-
Incidents: Any incidents that have occurred.
-
Host IP: The IP address of the host machine.
-
-
Bytes Sent and Received: This graph displays the number of bytes that were sent and received per minute. Click on the graph to drill down to the Bytes Sent Metric page.
-
Connections
-
Remote Client: A unique hexadecimal number assigned to each connection.
-
Node ID: This is the node target name.
-
Outgoing Byte Backlog: The number of outgoing bytes in the backlog.
-
Outgoing Message Backlog: The number of outgoing messages in the backlog.
-
Up Since: The date and time from which the connection manager instance is up.
-
Bytes Received: The number of bytes received per minute.
-
Bytes Sent: The number of bytes sent per minute.
-
25.3 Summary Pages
These pages describe the target pages such as nodes, caches, services, and so on associated with the cluster.
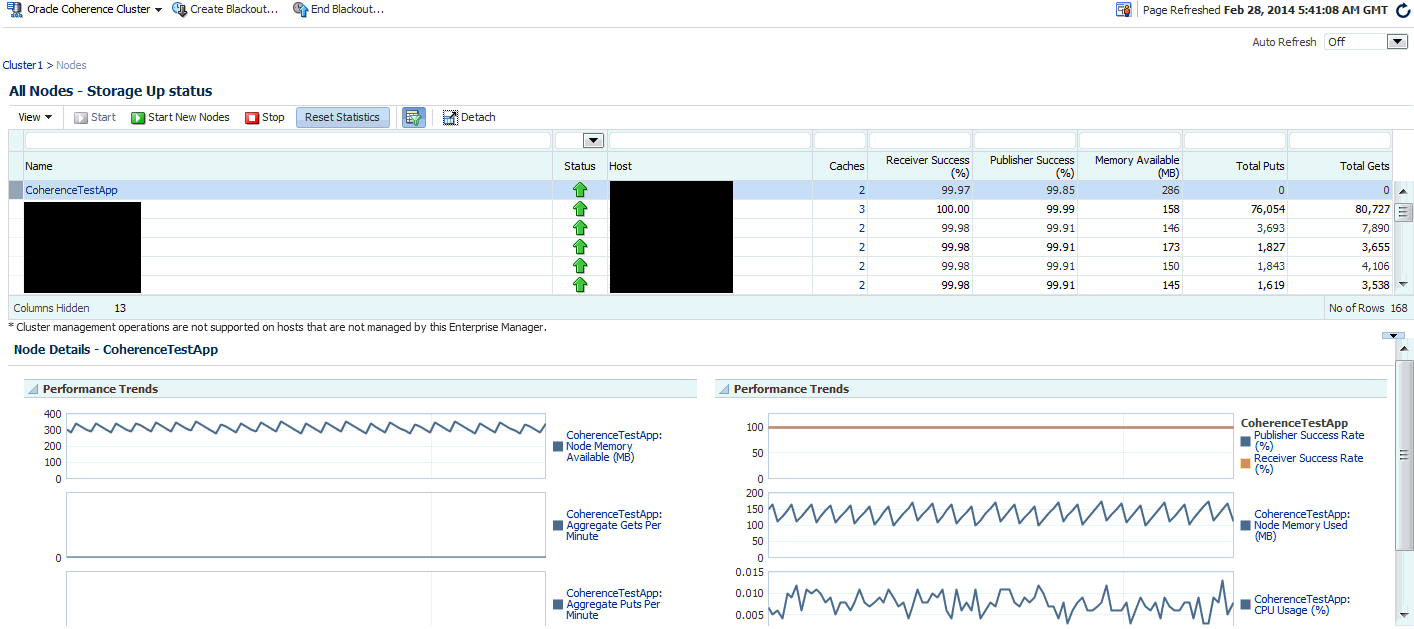
25.3.1 Nodes Page
This page lists all the discovered node targets that belong to the cluster, support a cache, or a service. The list of nodes displayed will vary depending on how you have navigated to this page.
This is a master detail page where you can select a node in the master table to view the key performance metrics in the Details region. The list of nodes displayed here can vary based on how you have navigated to this page. To view this page, you can:
-
From the Targets menu, select Middleware, then click on a Coherence Cluster. In the Oracle Coherence Cluster Home page, select Nodes from the Oracle Coherence Cluster menu. You can also navigate to this page from the Cache Home page.
-
Click on the Storage, Non Storage Nodes, or the Number of Nodes link in the Oracle Coherence Cluster Home page.
The following details are displayed by default. To display the hidden fields, from the View menu, select Columns, then select Manage Columns. In the Manage Columns table, select one or more columns from the Hidden Column list, move them to the Visible Columns list and click OK. The selected fields will be displayed in the table.
Note:
You can filter the list of nodes displayed in the table by specifying values in the Query by Example fields at the top of the table. If you want to see a list of nodes that are running on xyz host for instance, you can enter 'xyz' in the Host query field.-
Name: This is the name of the node target. Click on the link to drill down to the Node Home page.
-
Status: Shows whether the node is Up, Down, in an Error, or Unknown status.
-
Host: The host on which node is running. If the host is a monitored target in Enterprise Manager, you can click on the link to drill down to the Host Home page.
-
Caches: The total number of cache targets that this node supports.
-
Receiver Success (%): The percentage of received packets out of the total packets sent.
-
Publisher Success (%): This is the rate at which the publisher transmits packets on the network.
-
Memory Available (MB): The memory available on this node.
-
Total Puts: The aggregate number of put operations.
-
Total Gets: The aggregate number of get operations.
Select a node in the table to view a detailed graphical representation of the node. The following graphs are displayed.
-
Node Memory Available: This graph shows the nodes that have lowest available memory over the last 24 hours.
-
Aggregate Gets Per Minute: This graph displays the aggregate get operations across all the caches supported by the selected node.
-
Aggregate Puts Per Minute: This graph displays the aggregate put operations across all the caches supported by the selected node.
-
Publisher Success Rate: These graphs show the rate at which the publisher transmits packets on the network.
-
Receiver Success Rate: The percentage of received packets out of the total packets sent.
-
Node Memory Used (MB): The total memory used by the node.
-
CPU Usage (%): The CPU percentage used.
Note:
You can use the Personalization feature to customize these charts.You can perform the following actions:
-
Start: You can start any node that has a Down status. This option is available only if the node is running on an Enterprise Manager monitored host.
-
Stop: You can stop any node that has a Up status. This option is available only if the node is running on an Enterprise Manager monitored host.
-
Start New Nodes: You can start new nodes on the same host on which a selected node is running. The host must be monitored by Enterprise Manager.
-
Reset Statistics: Select a node and click Reset Statistics. You are prompted for the password for the host on which the node is running. Enter the password and click OK to reset the statistics. This option is available only for nodes with an Up status.
-
Query by Example: Click the Query by Example icon. In the Query row that appears, enter a query string in any of the columns to search for. All nodes that meet the specified criteria are displayed.
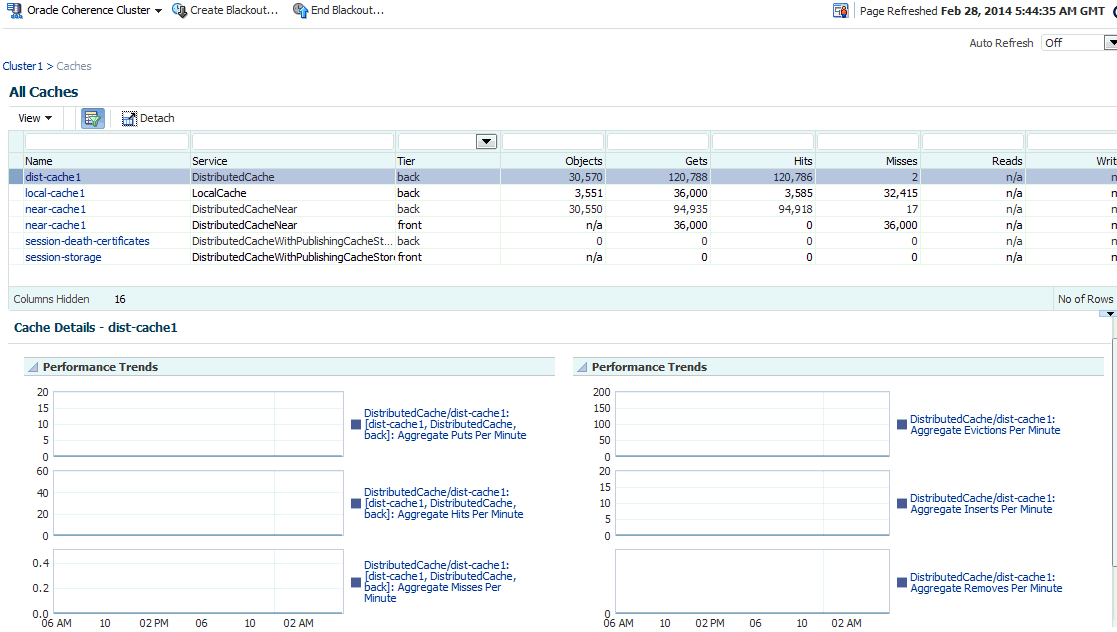
25.3.2 Caches Page
This page lists all the discovered cache targets that belong to the cluster. This is a master detail page where you can select a cache in the master table to view the key performance metrics in the Details region. The list of nodes displayed here can vary based on how you have navigated to this page. To view this page, you can:
-
From the Targets menu, select Middleware, then click on a Coherence Cluster. In the Oracle Coherence Cluster Home page, select Nodes from the Oracle Coherence Cluster menu.
-
Click on the Caches link in the Oracle Coherence Cluster Home page.
For each cache, the following details are displayed:
-
Name: This is the name of the cache target. Click on the link to drill down to the Cache Home page.
-
Service: The name of the caching service used by the cache.
-
Tier: The back tier is displayed for most caches. For a Near Cache, the cache can have front and back tiers. In this case, multiple rows for the same cache with unique tier values will be displayed.
-
Objects: The number of objects in the cache.
-
Gets: The aggregate number of get() operations in the cache.
-
Hits: The aggregate number of successful fetches of cached objects.
-
Misses: The aggregate number of failed fetches of cached objects.
-
Reads: The aggregate number of reads to a data store.
-
Writes: The aggregate number of writes to a data store.
Select a cache in the table to view a detailed graphical representation of the aggregated values across all the nodes supporting a cache. For example, Aggregate Puts Per Minute is the per minute value computed for put operations aggregated across all nodes supporting a cache.
By default, the following graphs are displayed but this can be customized. Click the Personalize button and select the graphs to be displayed and the metrics to be included in each graph.
-
Aggregated Puts Per Minute: The aggregate number of put operations per minute across all the nodes supporting this cache.
-
Aggregated Hits Per Minute: The aggregate number of get operations per minute across all the nodes supporting this cache.
-
Aggregated Misses Per Minute: The aggregate number of failed fetches of the cached objects per minute across all the nodes supporting this cache.
-
Aggregated Evictions Per Minute: The aggregate number of eviction operations per minute across all the nodes supporting this cache.
-
Aggregate Inserts Per Minute: The aggregate number of insert operations per minute across all the nodes supporting this cache.
-
Aggregate Removes Per Minute: The aggregate number of delete operations per minute across all the nodes supporting this cache.
25.3.3 Services Page
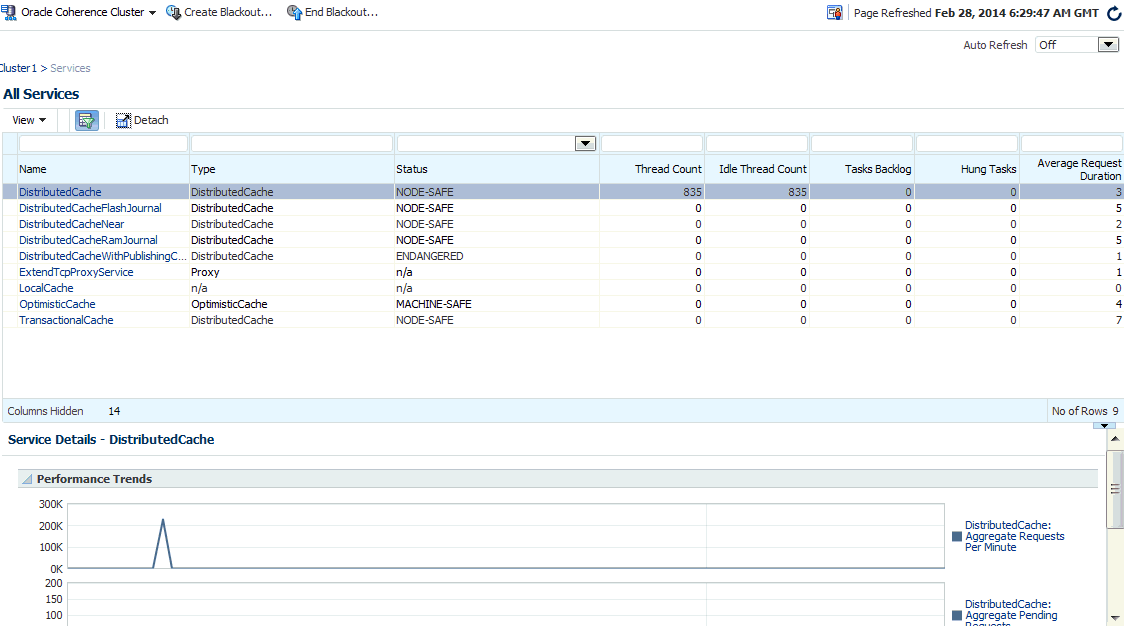
This page lists all the discovered service targets that belong to the cluster. This is a master detail page where you can select a service in the master table to view the key performance metrics in the Details region. The list of nodes displayed here can vary based on how you have navigated to this page. To view this page, select the Services option from the Oracle Coherence Cluster menu.
For each service, the following details are displayed:
-
Name: The name assigned to the service. Click on the link to drill down to the Service Home page.
-
Type: Some of the service types available are:
-
Cluster Service: This service is started when a cluster node needs to join the cluster. It keeps track of the membership and services in the cluster.
-
Distributed Cache Service: Allows cluster nodes to distribute (partition) data across the cluster so that each piece of data in the cache is managed (held) by only one cluster node.
-
Invocation Service: This service provides clustered invocation and supports grid-computing architecture.
-
Replicated Cache Service: This is the synchronized replicated cache service, which fully replicates all of its data to all cluster nodes that are running the service.
-
-
Status: The High Availability status for this service. This can be:
-
MACHINE-SAFE: This means that all the cluster nodes running on any given machine could be stopped at once without data loss.
-
NODE-SAFE: This means that any cluster node could be stopped without data loss.
-
ENDANGERED: This indicates that termination of any cluster node that runs this service may cause data loss.
-
RACK-SAFE: This status indicates that a rack can be stopped without any data loss.
-
SITE-SAFE: This status indicates that a site can be stopped without any data loss.
-
-
Thread Count: The number of threads in the service thread pool.
-
Idle Thread Count: The number of currently idle threads in the service thread pool.
-
Tasks Backlog: The size of the backlog queue that holds tasks scheduled to be executed by one of the service pool threads.
-
Hung Tasks: The id of the of the longest currently executing hung task.
-
Average Request Duration: The average duration (in milliseconds) of an individual synchronous request issued by the service.
Select a service in the table to view a detailed graphical representation of the aggregated values across all the nodes supporting the service. The following graphs are displayed.
-
Aggregated Requests Per Minute: The total number of the synchronous requests issued by the service.
-
Aggregated Pending Requests: This graph displays the aggregate number of pending requests issued by the service.
-
Average Active Threads: This graph displays the average number of active threads in the service thread pool.
25.3.4 Applications Page
This page lists all the applications associated with the cluster. For each application, the following details are displayed:
-
Local Attribute Cache
-
Local Session Cache
-
Overflow Cache
-
Clustered Session Cache
Click on the Application Name link to drill down to the Application Home page.
25.3.5 Proxies Page
This page shows the performance of all connection managers and connections in the cluster. To view this page, select Proxies from the Coherence Cluster menu. The following Connection Manager graphs are displayed:
-
Top Connection Managers with Most Bytes Sent since the connection manager's statistics were last reset.
-
Top Connection Managers with Most Bytes Received since the connection manager's statistics were last reset.
A table with the list of Connection Managers is displayed with the following details:
-
Connection Manager: This is the name of the connection manager. It indicates the Service Name and the Node ID where the Service Name is the name of the service used by this Connection Manager. Click on the link to drill down to the Connection Manager Home page.
-
Service: The name of the service. Click on the link to drill down to the Service Home page.
-
Node ID: This is the node target name.
-
Bytes Sent: The number of bytes sent per minute.
-
Bytes Received: The number of bytes received per minute.
-
Outgoing Buffer Pool Capacity: The maximum size of the outgoing buffer pool.
-
Outgoing Byte Backlog: The number of outgoing bytes in the backlog.
The following Connection related graphs are displayed:
-
Top Connections with Most Bytes Sent since the connection's statistics were last reset.
-
Top Connections with Highest / Most Bytes Received since the connection's statistics were last reset.
A table with the list of connections is displayed. Click on the link to drill down to the Details page.
-
Remote Client: The host on which this connection exists.
-
Up Since: The date and time from which this connection is running.
-
Connection Manager: The name of the connection manager. Click on the link to drill down to the Connection Manager Home page.
-
Service: The name of the service. Click on the link to drill down to the Service Home page.
-
Node ID: This is the node target name.
-
Bytes Sent: The number of bytes sent per minute.
-
Bytes Received: The number of bytes received per minute.
-
Connection Time: The connection time in milliseconds.
-
Outgoing Message Backlog: The number of outgoing messages in the backlog.
-
Outgoing Byte Backlog: The number of outgoing bytes in the backlog.
25.4 Performance Pages
This section describes the Performance Summary page, and the service and connection manager performance pages.
25.4.1 Performance Summary Page
The Performance Summary page can be used to monitor the performance of the selected component or application. To view this page, select Monitoring, then Performance Summary from the Oracle Coherence Cluster menu. The performance page typically contains:
-
A set of default performance charts that shows the values of specific performance metrics over time. You can customize these charts to help you isolate potential performance issues.
-
A series of regions that is specific to the component or application. For example, the Oracle Cache Performance Summary page displays metrics such as Aggregate Cache Objects, Aggregate Evictions, Maximum Query Duration, and so on.These sections will vary from component to component.
25.4.1.1 Customizing the Performance Page Charts
The Performance page is configured to provide a default set of metric charts, but you can customize the charts in different ways. You can identify potential performance issues by correlating and comparing specific metric data. To customize the charts, some of the actions you can perform are:
-
Click Show Metric Palette to display a hierarchical tree, containing all the metrics for the selected component or application. The tree organizes the performance metrics into various categories of performance data.
-
Select a metric in the palette to display a performance chart that shows the changes in the metric value over time. The chart will continue to refresh automatically to show updated data.
-
Click the "x" icon on the chart to close a chart. Click and drag the right side of the chart to move the chart to a new position on the page.
-
Drag and drop a metric from the metric palette and drop it on top of an existing chart. The existing chart will show the data for both metrics.
See the Enterprise Manager Online Help for more details on customizing the Performance Page.
25.4.2 Service Performance Page
This page displays the performance of the selected service over a specific period of time. The Request Average Duration and the Request Max Duration charts are displayed.
25.4.3 Connection Manager Performance Page
This page displays the performance of the selected connection manager over a specified period of time. The following graphs are displayed:
-
Bytes Sent: This graph shows the number of bytes sent since the connection manager was last started.
-
Bytes Received: This graph shows the number of bytes received since the connection manager was last started.
Performance:
The average performance over the selected period is displayed.
-
Outgoing Byte Backlog: The number of outgoing bytes in the backlog.
-
Outgoing Message Backlog: The number of outgoing messages in the backlog.
-
Incoming Buffer Pool Capacity: The maximum size of incoming buffer pool.
-
Incoming Buffer Pool Size: The currently used value of the incoming buffer pool.
-
Outgoing Buffer Pool Capacity: The maximum size of the outgoing buffer pool.
-
Bytes Received: The number of bytes received per minute.
-
Bytes Sent: The number of bytes sent per minute.
25.5 Viewing Incidents
The Incident Manager shows incidents for a target and its members. When the Incident Manager is launched from Coherence Cluster target, incidents for Cluster, Node and Cache targets in cluster are displayed. Similarly, when the Incident Manager is launched in the context of Node target, incidents for the Node target and for all Cache targets that are deployed on the node are displayed. When Incident Manager is launched from the Cache target, incidents for that target are displayed.
You can launch the Incident Manager by clicking on the number of Incidents in the General section for Coherence Cluster, Node and Cache targets. Alternatively, from the Oracle Coherence Cluster (Node or Cache) menu, select Monitoring, then select Incident Manager to navigate to the Incident Manager page.
25.6 Target Information
From the Oracle Coherence Cluster menu, select Target Information. The following information is displayed for the target in a pop-up window.
-
Up Since: The date and time from which the cluster is up and running.
-
Availability%: The percentage of time that the management agent was able to communicate with the cluster. Click the percentage link to view the availability details for the past 24 hours.
-
Version: The version of Coherence software obtained from Cluster MBean.
-
Oracle Home: The location of the Oracle Home.
-
Agent: The Management Agent that Oracle Enterprise Manager is using to communicate with the MBean Server. Click on the link to drill down to the Agent Home page.
-
Host: The host on which the cluster is running. Click on the link to drill down to the Host Home page.
-
Name: This is the actual name of the cluster that is discovered and may be different from the name of the cluster target in Enterprise Manager.
-
Auto Detect Restarted Nodes: The value displayed can be true or false and indicates whether all the nodes in this cluster have been started with the
tangosol.coherence.management.extendedmbeannameproperty. -
MBean Server Host: Shows the host on which the Coherence management node with Mbean Server is running.
If the node on the MBean Server Host is not accessible, the monitoring capability of the node will be affected. To avoid this, we recommend that at least two management nodes are running in the cluster. If a management node departs from the cluster, you must update the host and port target properties to point to the host with the running management node.
