23 Using Middleware Diagnostics Advisor
The Middleware Diagnostics Advisor analyzes the entire stack and provides diagnostic findings by identifying the root cause of a problem. It correlates and analyzes the input and offers advice on how to resolve the problem. For example, it can help you identify that slow SQL statements or a JDBC connection pool is causing a performance bottleneck.
You can view the diagnostic findings for one or more servers in a WebLogic Domain if the Middleware Diagnostics Advisor has been enabled.
This section covers the following:
-
Diagnosing Performance Issues Using Middleware Diagnostics Advisor
-
Using Middleware Diagnostics Advisor to View and Diagnose Performance Issues
-
Troubleshooting Issues Related to Middleware Diagnostics Advisor
23.1 Diagnosing Performance Issues with Oracle WebLogic Server
Oracle WebLogic Server (WLS) is an application server that provides high performance and scalability. WebLogic Server also simplifies deployment and management, and accelerates time to market with a modern, lightweight development platform.
In order to keep up the performance, and scalability of WLS, it is best to detect violations and provide insight to the cause of the violation, thus enabling faster remedial action. Performance related issues are detected based on the configuration and load of the server. The most common performance issues include slow response times, and application crashes. Using Middleware Diagnostics Advisor (MDA) adds value to the WebLogic Management Pack. To find out more about using MDA for WebLogic Servers, refer Section 23.2.
23.2 Diagnosing Performance Issues Using Middleware Diagnostics Advisor
Middleware Diagnostics Advisor or MDA is a diagnostic module integrated within Enterprise Manager Cloud Control for diagnosing performance issues with targets monitored in Enterprise Manager Cloud Control. Currently, MDA is supported for Oracle WebLogic Server 10g Release 3 (10.3) and higher. MDA monitors JDBC DataSources, EJBs, and JMS Queues.
MDA enables you to easily identify the underlying states in the application server environment that are that cause degradation in performance. These underlying states can manifest themselves as degradation in performance such as slow response for request, hung server, slow server, high memory utilization and high Disk I/O, and so on.
MDA analyses the overall performance of an aspect in a runtime environment. When the overall performance of the aspect degrades beyond a certain limit, MDA diagnoses the issue to find the underlying cause. However, individual one off issues, which do not affect the overall performance, are not isolated by MDA.
MDA diagnoses performances issues in the following areas:
-
JDBC findings:
-
Checks if the SQL execution takes a long time.
-
Checks if the JDBC Pool size is small, and if the wait time for connections is high.
-
Checks if reclaimed connections are found for data source, and if the effective pool size is small.
-
-
JMS findings:
-
Checks if the message processing is slow.
-
Checks if the number of messages reprocessed due to transaction timeout is high.
-
Checks if the number of messages reprocessed due to transaction rollback is high
-
Checks if the message delivery is delayed.
-
Checks if the queue slowed down due to large number of messages.
-
Checks if the queue slowed down due to large size of messages.
-
-
EJB findings:
-
Checks if the remote call made by the EJB takes too long to return.
-
Checks if the EJB takes too long to execute.
-
-
Thread findings:
-
Checks if there are locks that are being waited on by other threads.
-
Note:
To view a visual demonstration on how you can use the Middleware Diagnostics Advisor to accurately size the JDBC Connection Pool, access the following URL and click Begin Video.23.3 Functioning of Middleware Diagnostics Advisor
Middleware Diagnostics Advisor functions in the following way:
-
Data Collector, located on the target server, collects data at a high frequency. The collected data is then aggregated every 5 minutes.
-
Oracle Management Agent uploads the aggregated data to the Oracle Management Repository periodically.
-
On the OMS, an MDA analysis job runs every 15 minutes, and analyzes the data uploaded to Oracle Management Repository.
-
An analysis is performed every hour. If the analysis is begun at the middle of an hour, it will still be performed for the entire hour. For example, if the analysis is begun at 2:15 PM, the analysis will be performed from 2:00 PM to 3:00 PM.
At the end of the analysis hour, rules are applied to see if there are issues. There are rules which also determine the cause of the problem.
23.4 Limiting the Scope of Middleware Diagnostics Advisor
Using emctl, you can disable certain checks performed on targets by MDA. The following table provides the name of the check, the command, and the description.
| Check | Command | Description |
|---|---|---|
| Thread Analysis | emctl set property -sysman_pwd <sysman password> -name oracle.sysman.emas.mda.disableThreadAnalysis -value true |
Disables Thread Analysis check for targets. Global setting, so cannot be used for individual targets. |
| EJB Analysis | emctl set property -sysman_pwd <sysman password> -name oracle.sysman.emas.mda.disableEJBAnalysis -value true |
Disables EJB Analysis check for targets. Global setting, so cannot be used for individual targets. |
| JDBC Analysis | emctl set property -sysman_pwd <sysman password> -name oracle.sysman.emas.mda.disableJdbcAnalysisForTargets -value <comma-separated-target-names | all> |
Disables JDBC Analysis check for targets. Enter individual targets in a comma separated list. If disabling for all targets, enter all. |
| JMS Analysis | emctl set property -sysman_pwd <sysman password> -name oracle.sysman.emas.mda.disableJmsAnalysisForTargets -value <comma-separated-target-names | all> |
Disables JMS Analysis check for targets. Enter individual targets in a comma separated list. If disabling for all targets, enter all. |
23.5 Prerequisites
Before you begin using MDA for diagnosing performance issues, meet the following prerequisites.
-
Enterprise Manager has discovered the WebLogic Server as a target.
-
Before enabling MDA on a target, force the configuration collection for the target.
-
The JVMD Manager is configured, and the JVMD Agent is deployed on the target server.
-
Ensure that you have already added preferred credentials for the host, and administrator credentials for WebLogic.
-
Ensure that you have already enabled JVMD.
Note:
If the JVMD Agent war file is deployed manually to Oracle WebLogic Server, follow these steps:-
Copy
<MWHOME>/plugins/oracle.sysman.emas.oms.plugin_<pluginversion>/archives/jvmd/javadiagnosticagent.earto a temporary directory. -
Change to the temporary directory.
cd/scratch/temp -
Extract the files from the .ear file using the following command.
jar -xvf javadiagnosticagent.ear -
Copy the
jamagent.warfile that was used to deploy the JVMD agent to this directory. -
Create .ear file using the following command.
jar -cvf javadiagnosticagent.ear * -
Deploy
javadiagnosticagent.earmanually, and enable MDA.
23.6 Enabling Middleware Diagnostics Advisor
MDA is enabled as soon as the JVMD Agent is deployed. To manually enable or disable MDA, follow these steps:
-
From the WebLogic Domain menu, select Diagnostics, then select Middleware Diagnostics Advisor Configuration.
-
On the Middleware Diagnostics Advisor Configuration page, select the target that you want to enable MDA for, and click Enable. (See Figure 23-1.)
Note:
To enable targets to be monitored by MDA, the host and domain credentials have to be provided. If you have already set up the credentials, select the required credentials in the Host Credentials and Domain Credentials tabs.If you have not set up the credentials, provide them in the host and domain credentials tabs and proceed with the enabling of targets.
Figure 23-1 Middleware Diagnostics Advisor Configuration Page

Description of "Figure 23-1 Middleware Diagnostics Advisor Configuration Page"
23.7 Setting Up Middleware Diagnostics Advisor (MDA)
MDA can be set according to your preference. To set up MDA, follow these steps:
-
From the Setup menu, select Middleware Management, and then select Middleware Diagnostics Advisor.
-
On the Middleware Diagnostics Advisor Setup page, you can do the following:
-
In the Analysis Job Configuration section, select Skip Analysis Runs for all MDA-Enabled Servers, if you want to skip all MDA analysis jobs.
Note:
Selecting this option does not stop the MDA Data Collector from functioning on the target managed server. -
There is an MDA job that runs every 24 hours which purges data from the repository. The job is enabled by default and it deletes any data older than 31 days.
To set your preferred frequency, in the Purge Policy section, you can select the Purge Data Older Than option, and enter the preferred number of days for which the data should be retained.
Note:
This is a global setting and will be applied for all targets, and all users. -
In the Finding Threshold Configuration section, set the threshold or limit (in percentage) beyond which violations should result in a finding, by adjusting the Violations Percentage. The default value is 10%.
Note:
This is a global setting and will be applied for all findings. -
To set the wait time period (in minutes) beyond which any messages picked up will be considered as violations, adjust the JMS Wait Time. The default value is 5 minutes.
Note:
This setting is applicable only to JMS wait time findings.
-
-
Click Apply.
23.8 Enabling JMS Destination Metrics
If Middleware Diagnostics Advisor is being enabled for the first time, it is recommended that you enable JMS Destination Metrics. However, in order to analyze JMS Queues, it is required to enable the metrics.
There are two methods that you can use to enable JMS Destination Metrics.
-
First method of enabling JMS Destination Metrics:
-
From the Enterprise menu, select Monitoring, and then select Monitoring Templates.
-
From the search options, select Oracle WebLogic Server from the Target Type menu, and select the Display Oracle Certified Templates check box.
-
Select the Oracle Certified MDA Template for WebLogic Server radio button, and click Apply.
-
On the following page, select the Template will only override metrics that are common to both template and target radio button. This option is selected by default.
-
From Destination Targets, click Add.
-
From the Search and Select: Targets dialog box, select the WebLogic server on which to enable JMS Destination Metric, and click Select.
-
Click Ok to apply the template on the selected targets.
-
-
Second method of enabling JMS Destination Metrics:
-
From the WebLogic Server menu, select Monitoring, and select Metric and Collection Settings.
-
From the View menu, select All Metrics, and scroll down the column to find JMS Destination Metrics.
-
Click Disabled from the column.
-
On the following page, click Enable. Once you click Enable, enter the preferred frequency, and click Continue.
-
On the following page, click OK.
-
23.9 Using Middleware Diagnostics Advisor to View and Diagnose Performance Issues
To use MDA to view and diagnose performance issues, follow these steps:
-
Navigate to the target home page. From the target specific menu, select Diagnostics, then select Middleware Diagnostics Advisor.
-
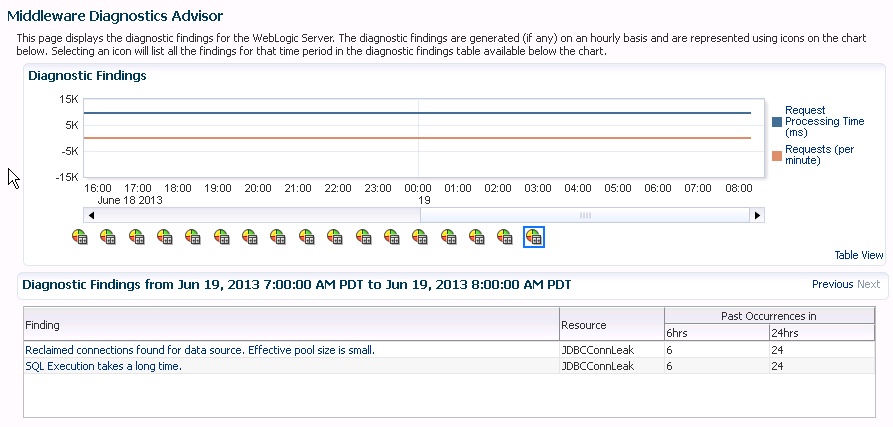
On the Middleware Diagnostics Advisor page, view the graphs for the Request Processing Time, and the Requests per minute.
-
To know more about findings, if any, click on the icon below the graphs. The icons indicating each finding will be displayed below the graph indicating the time frame of the findings.
-
Once you click the findings icon, the messages appear at the bottom of the screen in the Findings tab. See Figure 23-2 for an example of the Diagnostic Findings page.
-
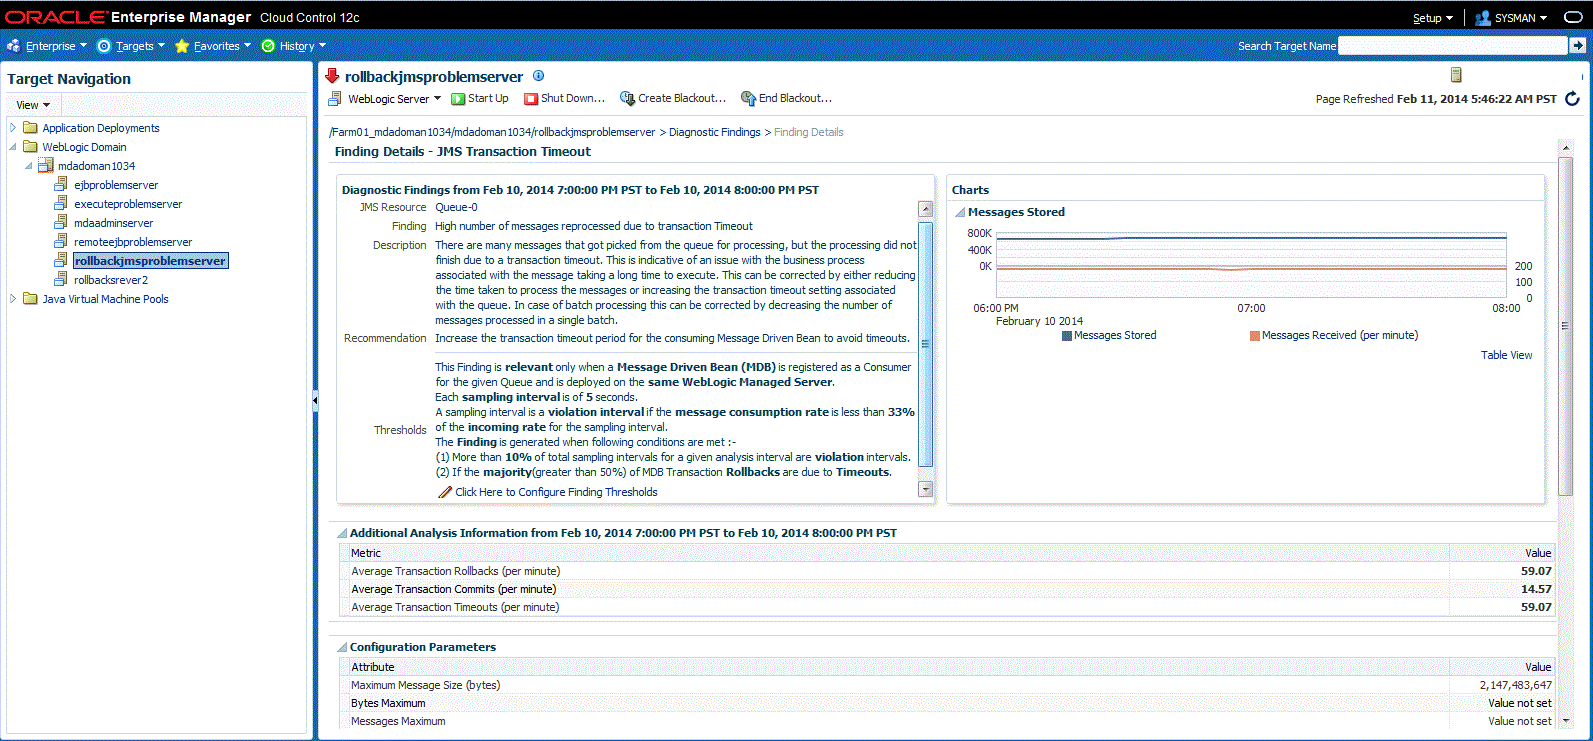
To view more details on the findings, expand the finding in the Finding column, and then click on the link of the finding that you want to view in detail. This will take you to the Finding Details page.
Alternatively, you can navigate to the Finding Details page by clicking on the Diagnostic Findings link in the Monitoring and Diagnostics section, on the target home page.
-
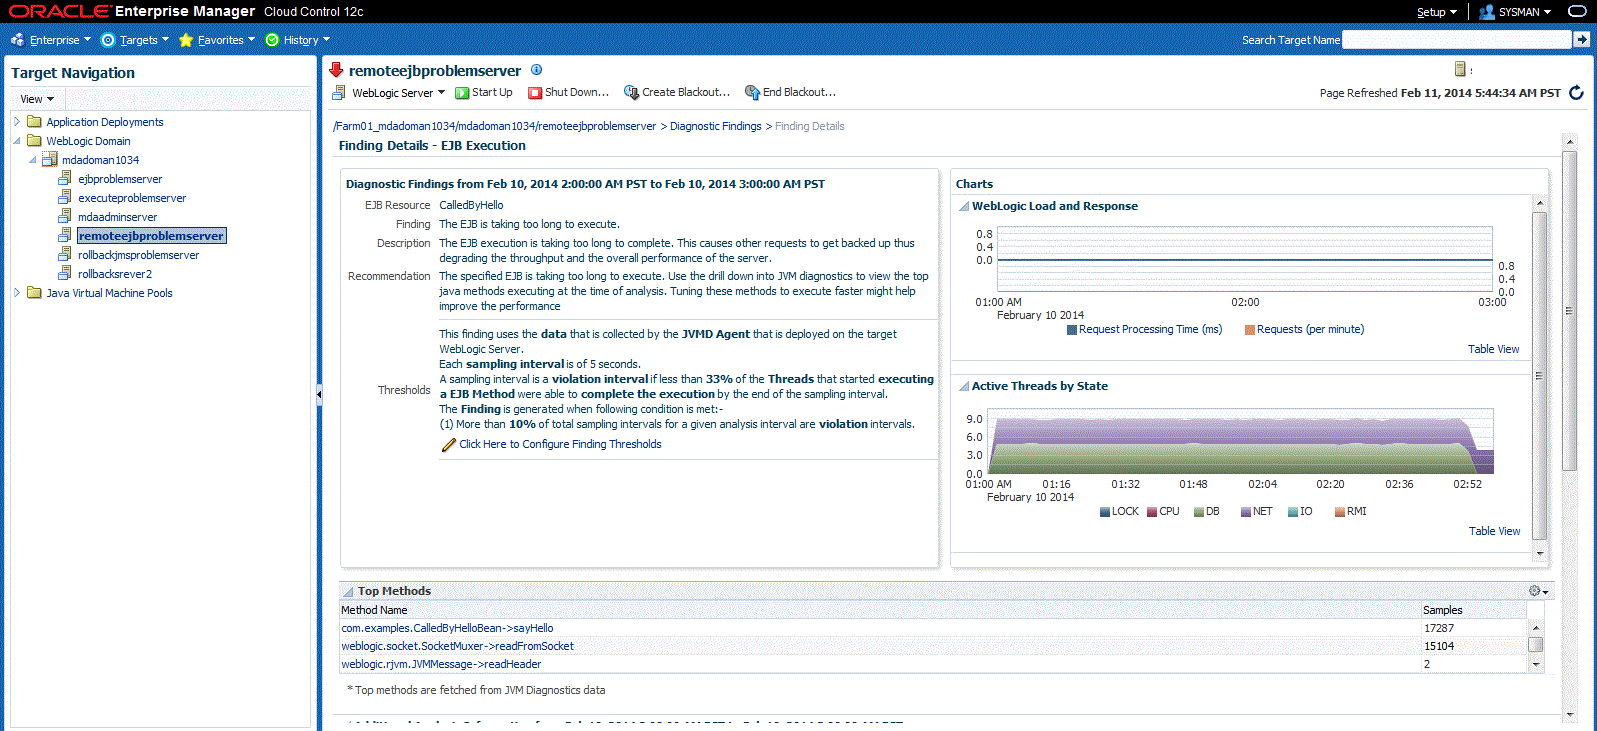
The Finding Details page displays the following for each finding:
-
Resource
The resource name for JMS Resource, EMS Resource, or JDBC Datasource.
-
Finding
The diagnostic finding for the Middleware domain.
For example: High number of messages reprocessed due to Transaction timeout.
-
Description
The description and reason for the diagnostic finding.
-
Recommendation
A solution or tip for the problem found.
-
Thresholds
The Thresholds section displays the threshold or limit (in percentage) beyond which violations should result in a finding. The threshold value displayed is the one last set. If you want to change the value, click the Click Here to Configure Finding Thresholds link. This takes you to the Middleware Diagnostics Advisor setup page, on which you can adjust the threshold value according to your preference.
-
Charts
The Charts section contains graphs pertaining to the finding. It displays graphs for messages stored, Weblogic load and response, active threads by state, and the like.
-
Additional Analysis Information
The additional analysis information for the diagnostic finding.
-
Configuration Parameters
The configuration parameters of the diagnostic finding during the time of the analysis.
-
Top Methods
The top method names for an EJB diagnostic finding. Top methods are fetched from JVM Diagnostics data.
See Figure 23-3 and Figure 23-4 for examples of the Finding Details page.
-
23.10 Troubleshooting Issues Related to Middleware Diagnostics Advisor
To troubleshoot issues related to MDA, follow the steps mentioned in the following table.
| Tip | How to |
|---|---|
| Ensure that MDA is enabled on the target. |
If the status is disabled, enable MDA for the target. |
| Ensure that MDA Analysis job is running properly. |
If there are no skipped or failed jobs, the Analysis job is running properly. |
| Ensure that the mda_dc_collection metric is getting collected from the EMD browser. |
Once you refresh the page, the data should be updated. |
| Ensure that the MDA data collector status check job is running properly, and there is no error in the job output. |
|
| The top SQLs are not displayed in a SQL execution finding | In a SQL execution finding, if the top SQLs are not displayed, ensure that the Database is registered with JVMD. To do so, follow these steps:
|


