8 Using Cloud Control with JD Edwards EnterpriseOne
This chapter contains the following topics:
-
Section 8.8, "Members of the JD Edwards EnterpriseOne Domain"
-
Section 8.9, "Updating the JD Edwards EnterpriseOne Domain (Refresh Discovery)"
-
Section 8.14, "Runtime Metrics (Status, User Count, and Performance)"
-
Section 8.15, "Configuration Metrics for JD Edwards EnterpriseOne"
-
Section 8.17, "Removing the JD Edwards EnterpriseOne Domain"
-
Section 8.18, "Starting and Stopping Components of Enterprise Manager Environments"
8.1 Additional Information for Cloud Control
For additional information, refer to these Cloud Control resources:
-
Enterprise Manager Documentation
http://download.oracle.com/docs/cd/E11857_01/index.htmThe above Oracle web site includes HTML and PDF versions of these documents:
-
Enterprise Manager Concepts
-
Administrator's Guide
-
Basic Installation Guide
-
Advanced Installation and Configuration Guide
-
Administrator's Guide for Software and Server Provisioning and Patching
-
Oracle Enterprise Manager List of Books
-
8.2 Using Cloud Control for the First Time
The Cloud Control console provides support for creating and managing Cloud Control administrator accounts. The Cloud Control administrators you create and manage in the Cloud Control console are granted privileges and roles to log in to the Cloud Control console and to manage specific target types and to perform specific management tasks.
During installation, these tasks are performed automatically:
-
A default Super Administrator SYSMAN account is created with the password you specified.
-
The SYSMAN account is automatically configured to receive email notifications, if you provided the email notification settings at installation time. Email notifications are set up with default Notification Rules for the critical conditions.
After installation, you can immediately log in to the Cloud Control console with the SYSMAN username and your password to perform management tasks. The next step is to create a new Super Administrator account to monitor and manage the JD Edwards EnterpriseOne targets.
Note:
The SYSMAN account owns the database schema containing the Management Repository and should not be used after the initial log in.8.3 Accessing the Cloud Control Console
To access Cloud Control, use the syntax of one of these URLs to log in to the Cloud Control console:
https://<Oracle Management Service_hostname>.<domain>:<port>/em
For example:
https://machine_host.company.com:1159/em
8.4 Cloud Control Home Page
On Select Enterprise Manager Home, you can choose a grid home page from the options shown on this screen. If these options do not match your job profile or role, you can use Setup > My Preferences to make any other page in Enterprise Manager as your home page. For instructions on making the JD Edwards Domain your home page in Enterprise Manager, refer to the Tip in the section in this chapter entitled: Section 8.7, "JDE EnterpriseOne Domain Home Page".
8.5 Targets
To view all existing Cloud Control targets, select the Targets pulldown control. This control displays rows that further define targets by type, such as groups, systems, services, hosts, databases, middleware (application servers), and composite applications.
8.6 Adding the JD Edwards EnterpriseOne Domain
Caution:
JD Edwards Tool Release 9.1 Update 4. In order for the discovery of the JD Edwards EnterpriseOne Application Pack to succeed, you must also follow the solution instructions on My Oracle Support in Document ID 1565988.1. In that document, refer to Issue #1, entitled: JDE Server Manager Discovery Issue. This refers to Bug 14734720 which is fixed for the Oracle Enterprise Manager Cloud Control. The backport to EM12cR2 (tracked as BLR bug 14753429) is available on ARU. Search for Patch Request 15585007.To add the JD Edwards EnterpriseOne domain to Cloud Control:
-
On Targets > Systems, use the domain selection pulldown menu to select this domain:
JDE EnterpriseOne Domain
-
On Systems, with the JDE EnterpriseOne Domain selected, click the Add button.
-
On Add JDE EnterpriseOne Domain, complete these fields:
-
EnterpriseOne Domain Target Name
Enter the name of the domain for JD Edwards EnterpriseOne. The name of the Server Manager host will be appended to this name if you do not specify it.
For example, your target name might be dev_env.
-
Enterprise Manager Agent Host Machine
Enter the machine name on which the Enterprise Manager agent is installed. For example, your machine name might be: denlx01.
Note:
It is recommended that you type the machine name in the field instead of using the search button to locate the machine name. -
Server Manager Host
Enter the fully qualified machine name of your Server Manager host. For example, your machine name might be: denv030.mlab.jdedwards.com.
-
Server Manager HTTP Port
Enter the HTTP port that will be used to connect to Server Manager. The default value is 8999.
-
Server Manager JMX Port
Enter the JMX port that will be used to connect to Server Manager. The default value is 14501.
-
Server Manager Admin User
The default value, which should not be changed, is jde_admin.
-
Server Manager Admin Password
Enter a valid value for the password of your Server Manager administrator.
-
-
Click the OK button to add the domain.
-
As it adds the JD Edwards Domain and associated targets, Cloud Control performs these functions:
-
Discovering: JD Edwards EnterpriseOne Domain
-
Creating: JD Edwards EnterpriseOne Domain target
-
Saving: JD Edwards EnterpriseOne Domain targets discovered
After the processing is complete the home page for the JD Edwards EnterpriseOne Domain is displayed, as shown below.
-
8.7 JDE EnterpriseOne Domain Home Page
-
On Targets > Systems, select the row where the Type column is JDE EnterpriseOne Domain.
-
On Systems, with the JDE EnterpriseOne Domain row highlighted, click the Edit button to display the Home page of the JDE EnterpriseOne Domain, as shown below.
Tip:
If your server is not listed, it may be because the Enterprise Manager default for the maximum number of servers to be shown in this list is 10. Refer to the Enterprise Manager documentation to customize this value. -
Another way to navigate to the JD Edwards EnterpriseOne Domain Home page is on Systems, on the row with the JDE EnterpriseOne Domain, click the hyperlink in the Name column where the Type column is JDE EnterpriseOne Domain. This is shown in the example below.
-
Optionally you can set the JD Edwards Domain as your Cloud Control home page, with the JD Edwards Domain page as the current page in your Cloud Control session, navigate Setup > My Preferences > Set Current Page as My Home (see below figure).
8.8 Members of the JD Edwards EnterpriseOne Domain
To display members of the JD Edwards EnterpriseOne Domain:
-
With the JD Edwards EnterpriseOne Domain displayed, in the upper left hand portion of the Cloud Control display, choose the Custom Menu pulldown, and then Members and Show All.
-
Cloud Control displays a list of members as shown in the following example:
8.9 Updating the JD Edwards EnterpriseOne Domain (Refresh Discovery)
To update the JD Edwards EnterpriseOne domain to Cloud Control, you will use Refresh Discovery as described below.
-
On the JD Edwards EnterpriseOne Domain Home Page, navigate Custom Menu > Refresh Discovery.
-
Cloud Control displays this warning page:
-
On the Warning screen for refreshing the JD Edwards Enterprise Domain, verify the target and click the Yes button to complete the refresh action.
The Cloud Control system processes the refreshing of the JD Edwards EnterpriseOne Domain and associated targets. When the process is complete, you are returned to the JD Edwards EnterpriseOne Domain Home Page.
8.10 Configuration Topology
There are several methods to display the configuration topology of the JD Edwards EnterpriseOne Domain.
-
On the JD EnterpriseOne Domain home page, in the upper left hand portion of the Cloud Control display, choose either of these navigations:
Custom Menu > Members > Topology
Custom Menu > Configuration > Topology
-
Cloud Control displays a topology graphic as shown in the following example:
8.11 System Monitoring Dashboard
Use the System Dashboard to view the health of managed targets within a group or system in real time. The System Dashboard presents information using intuitive icons and graphics that let you spot recent changes and quickly identify and respond to problems. You can:
-
Customize the display attributes to match information requirements of managed targets.
-
Monitor status for recent problems.
To access the System Monitoring Dashboard, navigate Custom Menu > Members > Dashboard. Below is an example of the dashboard for the JD Edwards EnterpriseOne Domain.
8.12 Monitoring Configuration
Cloud Control automatically sets up the monitoring configuration for the JDE EnterpriseOne targets.
-
To confirm, with a JDE target selected (for example, the HTML Server), navigate Custom Menu > Target Setup > Monitoring Configuration.
In the Monitoring section of the screen that indicates that monitoring is automatically enabled for this target's availability and performance, so no further monitoring configuration is necessary. You can edit the metric thresholds from the target's home page.
8.13 Latest Configuration Data
Use this procedure to obtain the latest configuration data for members of the JD Edwards EnterpriseOne Domain. This allows you to see configuration information that is in such files as the jde.ini and jas.ini. In addition to viewing the configuration information, you can Export or Detach it.
-
With a JD Edwards EnterpriseOne target selected, navigate Target > Configuration > Last Collected.
-
Cloud Control displays the latest configuration for the selected Target.
Below is an example of the latest configuration for the JD Edwards EnterpriseOne HTML Server.
Below is an example of the latest configuration for the JD Edwards EnterpriseOne Enterprise Server.
-
To display additional configuration details, expand the node for the Target and click the subnode.
Below is an example of a JD Edwards EnterpriseOne HTML Server with the JDE EnterpriseOne Configuration subnode expanded.
8.14 Runtime Metrics (Status, User Count, and Performance)
You can use Cloud Control to monitor the status of all members of the JD Edwards domain. Cloud Control can also monitor the performance of these JD Edwards EnterpriseOne servers:
-
Enterprise Server
-
HTML Web Server
-
On Members for JDE EnterpriseOne Domain, for each member you can view:
-
Status
-
Alerts
-
Policy Violations
-
-
For member Types EnterpriseOne Enterprise Server and EnterpriseOne HTML Server, you can view this type of performance data:
-
Home tab
User Count
-
Performance tab
Call Object Kernel Average Execute Time
-
Java Heap
-
Call Object Kernel Timeout Errors
Following are examples for each JD Edwards EnterpriseOne Server Type (Enterprise Server and HTML Server, respectively).
-
8.15 Configuration Metrics for JD Edwards EnterpriseOne
You can view all configuration metrics for these JDE EnterpriseOne member Types:
-
Section 8.15.1, "All Metrics for JD Edwards EnterpriseOne Enterprise Server"
-
Section 8.15.2, "All Metrics for JD Edwards EnterpriseOne HTML Server"
8.15.1 All Metrics for JD Edwards EnterpriseOne Enterprise Server
Use this procedure to view all metrics for the JD Edwards EnterpriseOne Enterprise Server
-
On Members for JDE EnterpriseOne Domain (or also from the Dashboard for the JDE EnterpriseOne Domain), click the link for the Name for the EnterpriseOne Enterprise Server.
-
With the JDE EnterpriseOne target displayed in Cloud Control, navigate Target > Monitoring > All Metrics.
-
On All Metrics, you can view any of the metrics that are available for the JD Edwards EnterpriseOne Enterprise Server. These metrics include:
-
Average CPU % Used by All Kernels
-
Enterprise Server Process Manager
-
Kernel Process
-
Kernel Thread
-
Network Process
-
Response
-
Total JDB Table Cache Count
-
Total JDE Cache
-
Total Number of DB Connections
-
Total Number of Incoming Network Connections
-
Total Number of Outstanding Requests
-
Total Number of Users
-
Other collected items
-
-
You can expand a metric node to view subnodes. The following screen is a sample of the metrics when you click on the Average Execution Time node.
-
You can also click on subnodes to display additional information. The following screen is a sample of the metrics shown when you click on the CallObj Avg Time subnode of the Average Execution Time node.
8.15.2 All Metrics for JD Edwards EnterpriseOne HTML Server
Use this procedure to view all metrics for the JD Edwards EnterpriseOne HTML Server
-
On Members for JDE EnterpriseOne Domain, click the link for the Name for the EnterpriseOne HTML Server.
-
With the JDE EnterpriseOne target displayed in Cloud Control, navigate Target > Monitoring > All Metrics.
-
On All Metrics, you can view any of the metrics that are available for the JD Edwards EnterpriseOne Enterprise Server. These metrics include:
-
Average Execution Time
-
Cache Group
-
Call Object (BSFN) Stats
-
Current number of open applications (All Users)
-
Database Datasource
-
General System Info and Uptime
-
JDB Service Cache
-
JDBj Cache Prepared Statement
-
JDBj Connection Manager
-
JDBj Pooled Connection
-
JDENET Connection Manager
-
JDENET Connection Pool Socket
-
Java Heap Memory Used
-
Response
-
Total Number of System Errors
-
Total Number of Timeout Errors
-
Total number of current users
-
Other collected items
-
You can expand a metric node to view subnodes. The following screen is a sample of the metrics when you click on the Call Object (BSFN) Stats node.
-
You can also click on subnodes to display additional information. The following screen is a sample of the metrics shown when you click on the Application Errors subnode of the Call Object (BSFN) Stats node.
-
8.16 Accessing Server Manager from Cloud Control
You can directly access the JD Edwards EnterpriseOne Server Manager used in this installation of Enterprise Manager. On the JD Edwards EnterpriseOne Domain Home Page, navigate Custom Menu > Server Manager.
You will be redirected to the Server Manager login page with this URL syntax:
http://SM_Host:SM Port/manage/home
where SM_Host and SM_Port are retrieved from the monitoring configuration. For example, the URL might be:
http://globalwin2.mlab.jdedwards.com:8999/manage/home
The Server Manager target machine is derived from the values in these fields on Monitoring Configuration:
-
Server Manager Hostname
-
Server Manager HTTP Port
For example:
Below is the Server Manager login page that is displayed when you are redirected.
After you enter valid credentials for this Server Manager, the Server Manager Home page is displayed as shown in the following example:
8.17 Removing the JD Edwards EnterpriseOne Domain
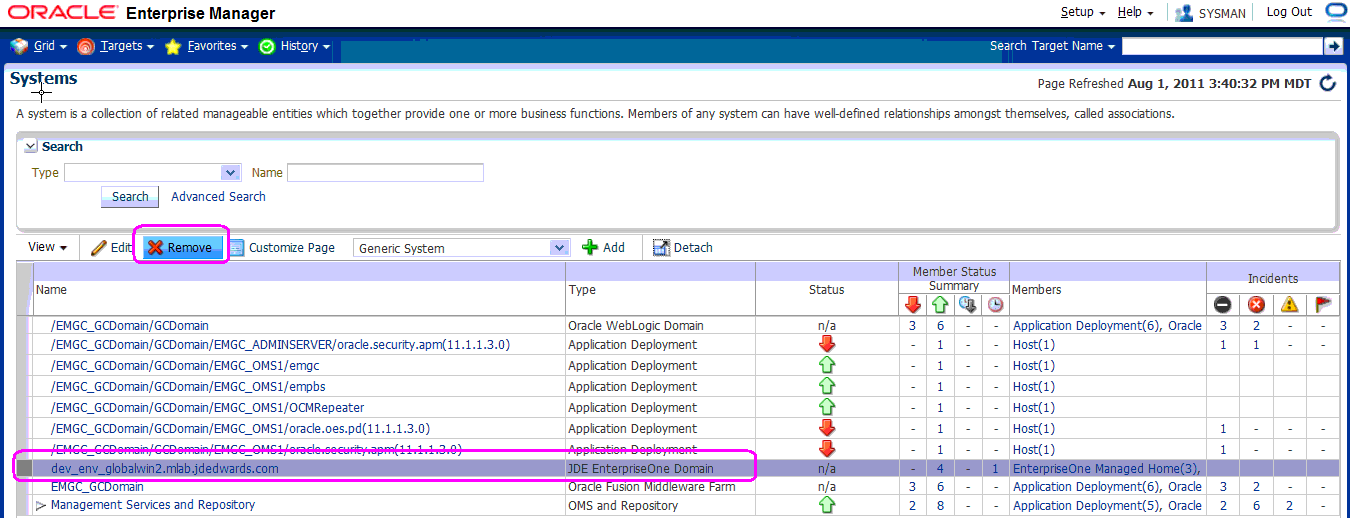
-
On Targets > Systems, with the JDE EnterpriseOne Domain selected, click the Remove button.
-
Cloud Control displays a Warning and lists the Domain target and associated EnterpriseOne targets that will be deleted.
-
As shown in the screen sample below, click the Yes button to confirm the deletion.
After you click the Yes button, Cloud Control displays the below progress screen indicating the deletion of the JD Edwards EnterpriseOne targets.
After the processing is complete for deleting the system domain target, Cloud Control returns to the All Targets page as shown in example below.
8.18 Starting and Stopping Components of Enterprise Manager Environments
This section discusses:
-
Section 8.18.1, "Starting Enterprise Manager Environment Components"
-
Section 8.18.2, "Stopping Enterprise Manager Environment Components"
8.18.1 Starting Enterprise Manager Environment Components
Use these commands to start Enterprise Manager environment components:
-
Start database
sqlplus '/as sysdba'
sql> startup
-
Start Database Listener
/u01/app/oracle/home/bin/lsnrctl start
-
Start WebLogic Node Manager
Stop ADMIN SERVER from console in case it is running without Node Manager
/u01/app/emgc12/wlserver_10.3/server/bin/setWLSEnv.sh
/u01/app/emgc12/wlserver_10.3/server/bin/startNodeManager.sh
-
Start OMS
/u01/app/emgc12/oms/bin/emctl start oms
-
Start Agent
/u01/app/emgc12/agent/agent_inst/bin/emctl start agent
8.18.2 Stopping Enterprise Manager Environment Components
Use these commands to stop Enterprise Manager environment components:
-
Stop Agent
/u01/app/emgc12/agent/agent_inst/bin/emctl stop agent
-
Stop OMS (this stops the OMS Server)
/u01/app/emgc12/oms/bin/emctl stop oms
-
Stop Database Listener
/u01/app/oracle/home/bin/lsnrctl stop
-
Stop Database
sqlplus '/as sysdba'
sql> shutdown immediate