| Oracle® Fusion Middleware 2 Day Administration Guide 11g Release 1 (11.1.1) Part Number E10064-03 |
|
|
PDF · Mobi · ePub |
| Oracle® Fusion Middleware 2 Day Administration Guide 11g Release 1 (11.1.1) Part Number E10064-03 |
|
|
PDF · Mobi · ePub |
Oracle Fusion Middleware components generate log files containing messages that record all types of events, including startup and shutdown information, errors, warning messages, access information on HTTP requests, and additional information. This chapter describes how to view and manage log files to assist in monitoring system activity and in diagnosing system problems.
This chapter contains the following topics:
Most Oracle Fusion Middleware components write diagnostic log files in the Oracle Diagnostic Logging (ODL) format. Log file naming and the format of the contents of log files conforms to an Oracle standard. By default, the diagnostic messages are written in text format.
ODL provides the following benefits:
The capability to limit the total amount of diagnostic information saved.
Older segment files are removed and newer segment files are saved in chronological fashion.
Components can remain active, and do not need to be shutdown, when older diagnostic logging files are deleted.
Note:
Oracle WebLogic Server does not use the ODL format. For information about the Oracle WebLogic Server log format, see Oracle Fusion Middleware Configuring Log Files and Filtering Log Messages for Oracle WebLogic Server.You can view the messages for all of the entities in a domain, a Managed Server, a component, or an application.
To view the log files and their messages for a Managed Server:
From the navigation pane, expand the farm, then WebLogic Domain, and then the domain. Right-click the Managed Server name and choose Logs, then View Log Messages.
The Log Messages page is displayed, as shown in the following figure:
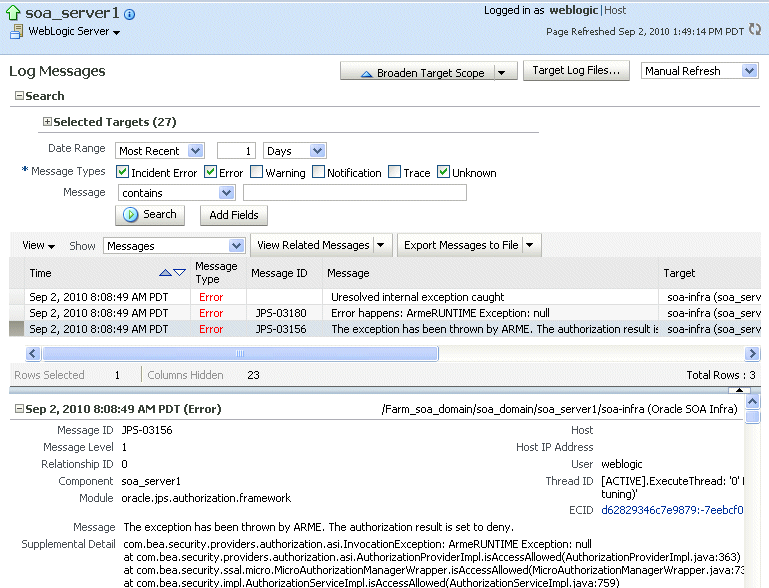
By default, this page shows the Incident Error and Error messages that occurred in the last hour. You can modify the criteria to include other message types or other time intervals.
By default, the messages are sorted by time, in ascending order. You can sort the messages by any of the columns, such as message type, by clicking the column name.
To view a summary of the messages, in the table, for Show, select Group by Message Type or Group by Message ID.
See Also:
Oracle Fusion Middleware Configuring Log Files and Filtering Log Messages for Oracle WebLogic Server for information about the viewing and searching Oracle WebLogic Server log files using the Oracle WebLogic Server Administration ConsoleYou can view the log files associated each component and the contents of the log files using Fusion Middleware Control.
To view the log files for a specific component:
From the navigation pane, expand the farm. For system components, expand the installation type and select the component. For Java components, expand the farm, then the component type, and then select the component.
From the dynamic target menu, choose Logs. Then, choose View Log Messages.
The Log Messages page is displayed.
Expand Selected Targets and in the row for a particular component or application, click the Target Log Files icon.
The Log Files page is displayed. On this page, you can see a list of log files related to the component or application.
Select a file and click View Log File.
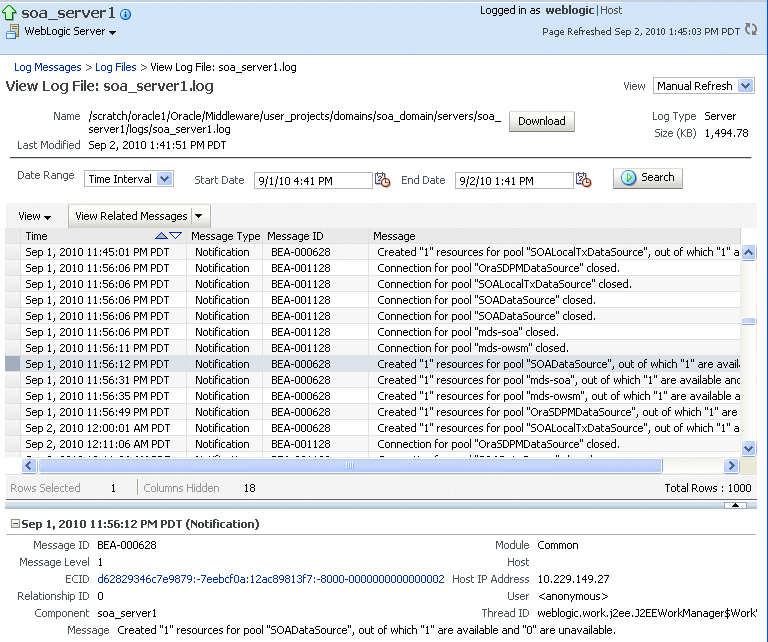
The View Log Files page is displayed. On this page, you can view the list of messages, or select a message to see its details.
To view the details of a message, select the message.
The details are displayed in the pane below the listing, as shown in the following figure:
You can search for diagnostic messages by time, type of message, and certain log file attributes by using the Log Messages page of the Fusion Middleware Control.
To search for messages:
From the navigation pane, expand the farm, and select the target, such as a Managed Server or Oracle HTTP Server.
From the dynamic target menu, choose Logs, then View Log Messages.
The Log Messages page displays a Search section and a table that shows a summary of the messages.
Depending on the component you selected, this page may show targets that are related to the component. To limit the targets, expand Selected Targets, select targets that you do not want included in the search, and click Remove.
In the Date Range section, you can select either:
Most Recent: If you select this option, select a time, such as 3 hours. The default is 1 hour.
Time Interval: If you select this option, select the calendar icon for Start Date. Select a date and time. Then, select the calendar icon for End Date. Select a date and time.
In the Message Types section, select one or more of the message types.
Click Search.
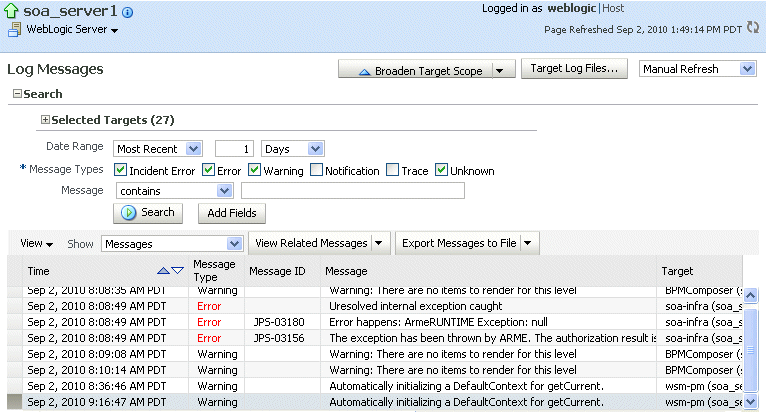
The following figure shows the Log Messages page with the results displayed:
You can also narrow your search by specifying additional criteria. For example, if you want to track a message that you saw when you viewed a log file's message (as described in Section 7.3), you can copy that message's Execution Context ID (ECID), and use it as a search criteria. This allows you to correlate messages across components of a farm and determine which other components have messages with the same ECID.
To narrow your search:
From the navigation pane, expand the farm. For system components, expand the installation type and select the component. For Java components, expand the farm, the domain, a Managed Server, and then select the component.
From the dynamic target menu, choose Logs, then View Log Messages.
The Log Messages page displays a Search section.
Click Add Fields, select a field, then click Add.
Select an operation, such as contains, and enter the value. For example, if you added the field Message ID, enter the Message ID, such as BEA-000386.
Click Search.
You can download the log messages to a file using Fusion Middleware Control. You can download either the summary messages, messages related to a particular component or log file, or messages of a specific type.
To download the log messages to a file using Fusion Middleware Control:
From the navigation pane, expand the farm, then WebLogic Domain. Select a domain or Managed Server.
From the dynamic target menu, choose Logs, then View Log Messages.
The Log Messages page is displayed.
Set criteria for the log messages you want displayed, as described in Section 7.4.
In the table, select a file type by clicking the arrow near Export All to File.
You can select one of the following:
As Oracle Diagnostic Log Text (.txt)
As Oracle Diagnostic Log Text (.xml)
As Comma-Separated List (.csv)
An Opening dialog box is displayed.
Either select Open With or Save to Disk. Click OK.
To export specific types of messages or messages with a particular Message ID to a file:
From the navigation pane, expand the farm, then WebLogic Domain, and then the domain. Select a Managed Server.
From the dynamic target menu, choose Logs, then View Log Messages.
The Log Messages page is displayed.
Set criteria for the log messages you want displayed, as described in Section 7.4.
For Show, select Group by Message Type or Group by Message ID.
To download the messages into a file, if you selected Group by Message Type, select the link in one of the columns that lists the number of messages, such as the Errors column. If you selected Group by Message ID, select one of the links in the Occurrences column.
The Messages by Message Type page or Message by Message ID is displayed.
Select a file type by clicking the arrow near Export All to File.
You can select one of the following:
As Oracle Diagnostic Log Text (.txt)
As Oracle Diagnostic Log Text (.xml)
As Comma-Separated List (.csv)
An Opening dialog box is displayed.
Either select Open With or Save to Disk. Click OK.
To download the log files for a specific component using Fusion Middleware Control:
From the navigation pane, expand the farm. For system components, expand the installation type and select the component. For Java components, expand the farm, then the component type, and then select the component.
From the dynamic target menu, choose Logs, then View Log Messages.
The Log Messages page is displayed.
Click Target Log Files.
The Log Files page is displayed. On this page, you can see a list of log files related to the component or application.
Select a log file and click Download.
An Opening dialog box is displayed.
Select either Open With or Save to Disk. Click OK.
WLST Command:
displayLogs(options, export='filename')
You can change the log settings of Managed Servers and Java components using Fusion Middleware Control or WLST.
Note:
You cannot use Fusion Middleware Control or WLST to configure options for log files of system components, which are listed in Section 2.4.2.To change log file settings using Fusion Middleware Control, navigate to the component's home page and choose Logs, then Log Configuration from the dynamic target menu.
You can configure the following options:
The names and paths of log files. See Section 7.6.1.
The size of log files: You can specify that a new file is created either when the log file reaches a certain size or when a particular time is reached. This is called log file rotation. See Section 7.6.2.
The log level: You can specify the amount and type of information written to log files. See Section 7.6.3.
The log file format: You can specify whether the logs are written in text or XML format. See Section 7.6.4.
By default, Oracle Fusion Middleware writes log files for Java components to the following directories:
(UNIX) MW_Home/user_projects/domains/domain_name/servers/server_name/logs
(Windows) MW_Home\user_projects\domains\domain_name\servers\server_name\logs
The default name of a log file is server_name-diagnostic.log.
For example, the log files for Oracle SOA Suite are:
(UNIX) MW_Home/user_projects/domains/domain_name/servers/server_name/logs/server_name-diagnostic.log
(Windows) MW_Home\user_projects\domains\domain_name\servers\server_name\logs\server_name-diagnostic.log
You can change the name and location of a server or component. To change the name and location of a log file using Fusion Middleware Control, navigate to the entity's home page and choose Logs, then Log Configuration from the dynamic target menu.
For example, to change the name and location of the Oracle WebCenter Spaces log file using Fusion Middleware Control:
From the navigation pane, expand the entities and select WebCenter Spaces.
From the WebLogic Server menu, choose Logs, then Log Configuration.
The Log Configuration page is displayed.
Select the Log Files tab.
In the table, select the log handler and click Edit Configuration.
The Edit Log File dialog box is displayed, as shown in the following figure:
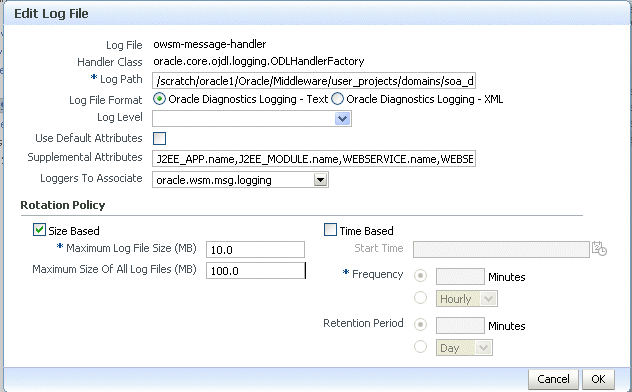
For Log Path, enter a new path.
Click OK.
In the confirmation window, click Close.
An ODL log is a set of log files that includes the current ODL log file and zero or more ODL Archives (segment files) that contain older messages. As the log file grows, new information is added to the end of the log file, server_name-diagnostic.log. When the log file reaches the rotation point, it is renamed and a new log file, server_name-diagnostic.log is created. You specify the rotation point, by specifying the maximum ODL segment size or the rotation time and rotation frequency.
Segment files are created when the ODL log file server_name-diagnostic.log reaches the rotation point. That is, the server_name-diagnostic.log is renamed to server_name-diagnostic-n.log, where n is an integer, and a new server_name-diagnostic.log file is created when the component generates new diagnostic messages.
By default, the log files are rotated when they reach 10 MB. The maximum size of all log files for a particular component is 100 MB.
To change log file rotation for a component, navigate to the component's home page in Fusion Middleware Control and choose Logs, then Log Configuration from the dynamic target menu.
To configure log file rotation based on size:
From the navigation pane, expand the farm, and select the target, such as a Managed Server.
From the dynamic target menu, choose Logs, then Log Configuration.
The Log Configuration page is displayed.
Select the Log Files tab.
In the table, select the logger and click Edit Configuration.
The Edit Log File dialog box is displayed.
In the Rotation Policy section, select Size Based.
For Maximum Log File Size, enter the size in MB, for example, 15.
For Maximum Size of All Log Files, enter the size in MB, for example, 150.
Click Apply.
To configure log file rotation based on time:
From the navigation pane, expand the farm, and select the target, such as a Managed Server.
From the dynamic target menu, choose Logs, then Log Configuration.
The Log Configuration page is displayed.
Select the Log Files tab.
In the table, select the logger and click Edit Configuration.
The Edit Log File dialog box is displayed.
In the Rotation Policy section, select Time Based.
For Start Time, click the calendar and select the date and time when you want the rotation to start. For example, select September 8, 2010 6:00 AM.
For Frequency, you can select Minutes and enter the number of minutes, or you can select Hourly, Daily, or Weekly. In this case, select Hourly. The log files will be rotated each hour.
For Retention Period, you can specify how long the log files are kept. You can select Minutes and enter the number of minutes, or you can specify Day, Week, Month, or Year. In this case, select Month.
Specifying a shorter period means that you will use less disk space, but will not be able to retrieve older information.
Click OK.
You can configure the amount and type of information written to log files by specifying the message type and level. For each message type, possible values for message level are from 1 (highest severity) through 32 (lowest severity). The lower severity levels write more information to the log files. Generally, you need to specify only the type; you do not need to specify the level.
When you specify the type, Oracle Fusion Middleware returns all messages of that type, as well as the messages that have a higher severity. For example, if you set the message type to WARNING, Oracle Fusion Middleware also returns messages of type INCIDENT_ERROR and ERROR.
Table 7-1 shows the message types and the most common levels for each type.
Table 7-1 Diagnostic Message Types and Level
| Message Type | Level | Description |
|---|---|---|
|
1 |
A serious problem that may be caused by a bug in the product and that should be reported to Oracle Support. Examples are errors from which you cannot recover or serious problems. |
|
|
1 |
A serious problem that requires immediate attention from the administrator and is not caused by a bug in the product. An example is if Oracle Fusion Middleware cannot process a log file, but you can correct the problem by fixing the permissions on the document. |
|
|
1 |
A potential problem, such as invalid parameter values or a specified file that does not exist, that should be reviewed by the administrator. |
|
|
1 |
A major lifecycle event such as the activation or deactivation of a primary sub-component or feature. This is the default level for NOTIFICATION. |
|
|
NOTIFICATION |
16 |
A finer level of granularity for reporting normal events. |
|
1 |
Trace or debug information for events that are meaningful to end users of the product, such as public API entry or exit points. |
|
|
TRACE |
16 |
Detailed trace or debug information that can help Oracle Support diagnose problems with a particular subsystem. |
|
TRACE |
32 |
Very detailed trace or debug information that can help Oracle Support diagnose problems with a particular subsystem. |
You can set the message level for a particular log file or for loggers. To change message level, navigate to the component's home page in Fusion Middleware Control and choose Logs, then Log Configuration from the dynamic target menu.
To set the message level for a component log file:
From the navigation pane, expand the farm, and select the target.
From the dynamic target menu, choose Logs, then Log Configuration.
The Log Configuration page is displayed.
Select the Log Files tab.
In the table, select the log file and click Edit Configuration.
The Edit Log File dialog box is displayed, as shown in the following figure:
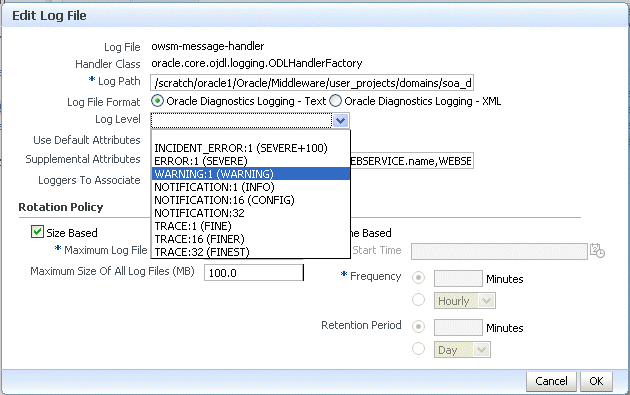
For Log Level, select the logging level. For example, select NOTIFICATION:1 (INFO).
Click OK.
In the confirmation window, click Close.
To set the message level for one or more loggers for a component:
From the navigation pane, expand the farm, and select the target.
From the dynamic target menu, choose Logs, then Log Configuration.
The Log Configuration page is displayed.
Select the Log Levels tab, which is shown in the following figure:
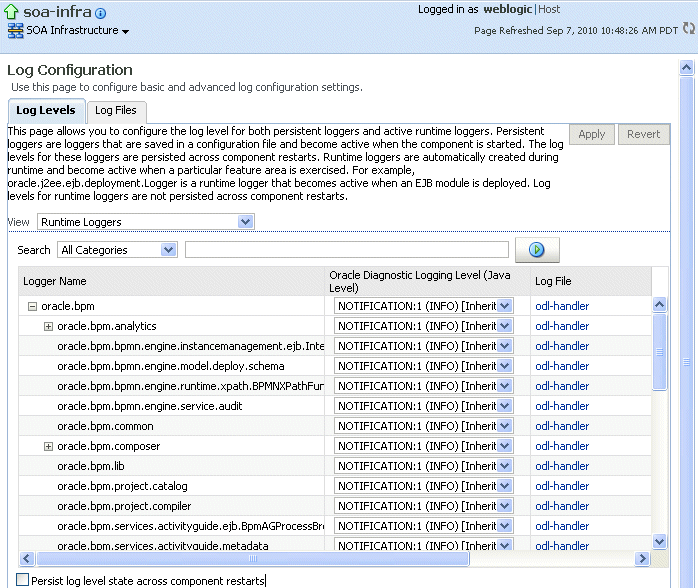
For View, select Runtime Loggers or Loggers with Persistent Log Level State.
Run-time loggers are loggers that are currently active. Persistent loggers are loggers that are saved in a configuration file and log levels of these loggers are persistent across component restarts. A run-time logger can also be a persistent logger, but not all run-time loggers are persistent loggers.
In the table, to specify the same level for all loggers, select the logging level for the top-level logger. Then, for child loggers that do not specify that the logging level is inherited from the parent, specify Inherited from Parent. For most situations, that is sufficient.
However, if you need to specify the level for a particular logger, expand the logger and then, for the logger that you want to modify, select the logging level. For example, for the logger oracle.wsm.management.logging, select WARNING:1 (WARNING).
Click Apply.
By default, information is written to log files in ODL text format. You can change the format to ODL XML format.
To change the format of the log file using Fusion Middleware Control:
From the navigation pane, expand the farm, and select the target, such as a component.
From the dynamic target menu, choose Logs, then Log Configuration.
The Log Configuration page is displayed.
Select the Log Files tab.
In the table, select the log file and click Edit Configuration.
The Edit Log File dialog box is displayed.
For Log File Format, select Oracle Diagnostics Logging - XML.
Click OK.
In the confirmation window, click Close.
For more information about the topics covered in this chapter and other logging and diagnostic topics, see:
"Managing Log Files" in the Oracle Fusion Middleware Administrator's Guide.
"Diagnosing Problems" in the Oracle Fusion Middleware Administrator's Guide for information about the Oracle Fusion Middleware Diagnostic Framework.
Oracle Fusion Middleware Configuring Log Files and Filtering Log Messages for Oracle WebLogic Server for information about the Oracle WebLogic Server log files and their format.