| Oracle® Fusion Applications Administrator's Guide 11g Release 1 (11.1.3) Part Number E14496-04 |
|
|
View PDF |
| Oracle® Fusion Applications Administrator's Guide 11g Release 1 (11.1.3) Part Number E14496-04 |
|
|
View PDF |
This chapter describes how to diagnose Java applications in the middle tier using Oracle Enterprise Manager Cloud Control (Cloud Control):
This chapter includes the following topics:
Mission critical Java applications often suffer from availability and performance problems. Developers and IT administrators spend a lot of time diagnosing the root cause of these problems. Many times, the problems occurring in production environments either cannot be reproduced or may take too long to reproduce in other environments. This can cause severe impact on the business.
Oracle Enterprise Manager Cloud Control (Cloud Control) enables you to diagnose performance problems in Java applications in the production environment. By eliminating the need to reproduce problems, it reduces the time required to resolve these problems. This improves application availability and performance. Using Java Virtual Machine (JVM) diagnostics, you can identify the root cause of performance problems in the production environment without having to reproduce them in the test or development environment. It does not require complex instrumentation or restarting of the application to get in-depth application details. Application administrators will be able to identify Java problems or Database issues that are causing application downtime without any detailed application knowledge.
To configure you environment for JVM Diagnostics, see the "Using JVM Diagnostics" chapter in the Oracle Enterprise Manager Getting Started with Fusion Middleware Management.
This section describes how to diagnose Java applications in the middle tier using Cloud Control:
To get started with monitoring JVM diagnostics with Cloud Control:
From the Targets menu, choose Targets > Middleware.
The Middleware target home page displays.
Search for the Oracle WebLogic Server domains:
From the Search area, click Advanced Search.
From the Type list, select Oracle WebLogic Domain or Oracle WebLogic Server; deselect the other options.
Click Search.
Click on a domain or one of its servers which has JVM Diagnostics agents deployed. For more information about installing JVM Diagnostics, see the Oracle Enterprise Manager Cloud Control Basic Installation Guide.
The WebLogic Server Domain Home page or WebLogic Server Home page displays.
From the WebLogic Domain or WebLogic Server menu, choose Diagnostics > JVM Diagnostics Home.
The JVM Diagnostics Home page displays.

Take note of the following:
In the Summary section, view the make and version of the JVM, optimization level, and the maximum and minimum heap memory.
In the Active Threads section, view the number of Java threads that are currently running in the for the domain or server. It is color-coded by thread state.
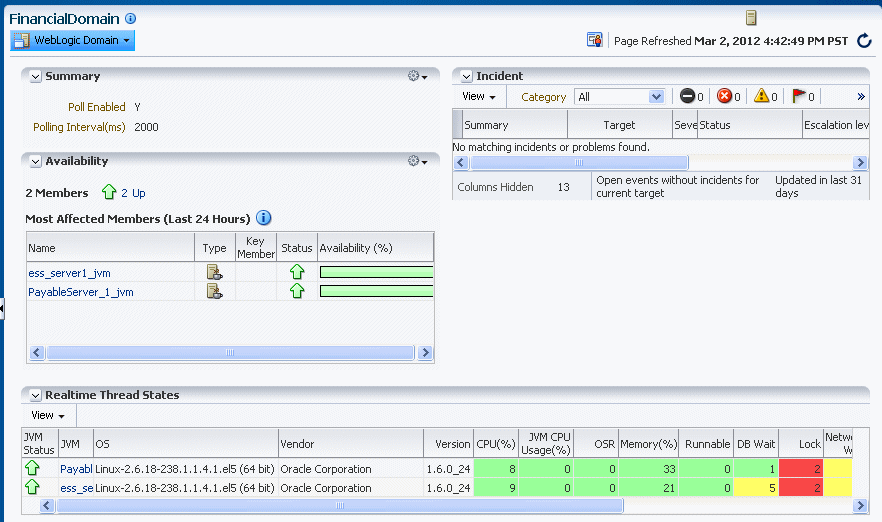
In the Realtime Thread State section, view the overall thread state, including locks.
From the WebLogic Domain or WebLogic Server menu, choose Diagnostics > JVM Diagnostics.
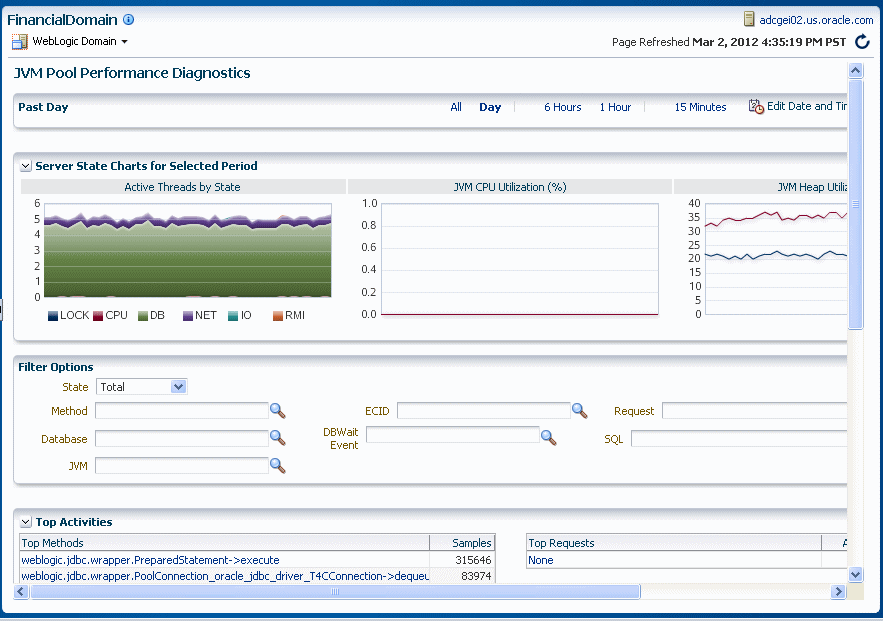
The JVM Diagnostics Pool Performance Diagnostics page displays for an Oracle WebLogic Server domain and the JVM Performance Diagnostics page displays for a Managed Server. While the JVM Diagnostics Pool Performance Diagnostics page provides information for the pool of JVMs in the domain, the JVM Performance Diagnostics page provides information for a single JVM. The following figure shows the JVM Diagnostics Pool Performance Diagnostics page for the domain:

View the various charts:
|
Server State Charts For Selected Period section |
This section displays the Active Threads, CPU Utilization, and Heap Utilization of IO, CPU, lock, and network resources during the selected time. The number of Java threads (daemon and non-daemon) that are currently running in the virtual machine for this Oracle WebLogic Server
|
|
General tab |
This section displays data from the JVM itself:
|
|
Threads tab |
|
Note:
The Compared with feature enables you to compare the diagnostics across two specified periods of time.
If you have a slow-running application, locate the Java method causing the potential issue.
To find the top Java methods with Cloud Control:
From the Targets menu, choose Targets > Middleware.
The Middleware target home page displays.
Search for the Oracle WebLogic Server domains:
From the Search area, click Advanced Search.
From the Type list, select Oracle WebLogic Domain or Oracle WebLogic Server; deselect the other options.
Click Search.
Click on a domain or one of its servers which has JVM Diagnostics agents deployed. For more information about installing JVM Diagnostics, see the Oracle Enterprise Manager Cloud Control Basic Installation Guide.
The WebLogic Server Domain Home page or WebLogic Server Home page displays.
From the WebLogic Domain menu or WebLogic Server menu, choose Diagnostics > JVM Performance Diagnostics.
The JVM Diagnostics Pool Performance Diagnostics page displays for an Oracle WebLogic Server domain and the JVM Performance Diagnostics page displays for a Managed Server.
In the Top Methods section, review the list of methods ordered by their cost (the number of samples).
In the Top Methods section, click on a method to add it as a filter.
In the Method Stack Tree dialog, click on the plus sign next to the method to investigate further.
The Method Stack Tree dialog displays with a call stack that you can traverse.
In the Method Stack Tree dialog, select the method, and then click OK.
The Filter Options section auto-fills the information on the method and the charts update to reflect that method, for example:
Heavy use of IO, CPU, lock, and network resources (Active Threads chart)
Request causing it to be invoked (Top Requests chart)
SQL or database state it causes (Top DBStates and Top SQLs charts)
After you are done viewing the method, in Filter Options section, clear out the Method text box filter and click anywhere to remove the filter.
If you suspect a slow SQL query is causing a network requests or IO issue, find the slowest SQL queries.
To find the top SQL calls using JVM diagnostics with Cloud Control:
From the Targets menu, choose Targets > Middleware.
The Middleware target home page displays.
Search for the Oracle WebLogic Server domains:
From the Search area, click Advanced Search.
From the Type list, select Oracle WebLogic Domain or Oracle WebLogic Server; deselect the other options.
Click Search.
Click on a domain or one of its servers which has JVM Diagnostics agents deployed. For more information about installing JVM Diagnostics, see the Oracle Enterprise Manager Cloud Control Basic Installation Guide.
The WebLogic Server Domain Home page or WebLogic Server Home page displays.
From the WebLogic Domain menu or WebLogic Server menu, choose Diagnostics > JVM Performance Diagnostics.
The JVM Diagnostics Pool Performance Diagnostics page displays for an Oracle WebLogic Server domain and the JVM Performance Diagnostics page displays for a Managed Server.
In the Top SQLs section, review the list of SQL calls ordered by their cost (the number of samples).
In the Top SQLs section, click on a SQL call to view the charts for that call.
The Filter Options section auto-fills the information on the method and the charts update to reflect that method. Adding the statement as a filter enables you to see everything related to that SQL call, for example:
Methods that invoke it (Top Methods chart)
Request causing it to be invoked (Top Requests chart)
Database state it causes (Top Databases chart)
After you are done viewing the method, in Filter Options section, clear out the SQL field and click anywhere to remove the filter.
If application users report a spinning status indication after clicking in the application, investigate the stuck threads.
To find the top SQL calls using JVM diagnostics with Cloud Control:
From the Targets menu, choose Targets > Middleware.
The Middleware target home page displays.
Search for the Oracle WebLogic Server domains:
From the Search area, click Advanced Search.
From the Type list, select Oracle WebLogic Domain or Oracle WebLogic Server; deselect the other options.
Click Search.
Click on a domain or one of its servers which has JVM Diagnostics agents deployed. For more information about installing JVM Diagnostics, see the Oracle Enterprise Manager Cloud Control Basic Installation Guide.
The WebLogic Server Domain Home page or WebLogic Server Home page displays.
From the WebLogic Domain menu, choose Diagnostics > Live Thread Analysis.
The Live Thread Analysis page displays.
In the JVMs section, click on a thread to show details in the JVM Threads section.
In the JVM Threads section, look for a thread having the prefix [STUCK THREAD] and click on it.
In the Thread Info and Thread Stack sections, look at the Current Call, File Name, Line, and State for the thread.
This information provides you with the key information on how to locate the code that is causing the problem:
Current Call: This field displays the name of the method call where the code is stuck.
File Name: This column identifies the file with the problem.
Line: This column identifies the line number in the file where the problematic code is.
State: This column displays the state of the thread (for example, CPU, IO, Network, DB Wait, Lock, and so on).
Look for the Lock Held in the Thread Info section.
If the stuck thread is in the DB Wait state, then click on the link and go directly to the database session to see what that thread is doing in the database, or use the technique described in Section 11.2.5.
If you issue an SQL query and it does not return, then analyze the SQL statement.
To analyze SQL from Cloud Control:
From the Targets menu, choose Targets > Middleware.
The Middleware target home page displays.
Search for the Oracle WebLogic Server domains:
From the Search area, click Advanced Search.
From the Type list, select Oracle WebLogic Domain or Oracle WebLogic Server; deselect the other options.
Click Search.
Click on a domain or one of its servers which has JVM Diagnostics agents deployed. For more information about installing JVM Diagnostics, see the Oracle Enterprise Manager Cloud Control Basic Installation Guide.
The WebLogic Server Domain Home page or WebLogic Server Home page displays.
From the WebLogic Domain menu, choose Diagnostics > JVM Performance Diagnostics.
JVM Diagnostics Pool Performance Diagnostics page displays for an Oracle WebLogic Server domain and the JVM Performance Diagnostics page displays for a Managed Server.
In the Top SQLs section, click on a SQL call to view the charts for that call.
In Filter Options section, in the SQL field, copy the ID of the SQL call.
Click on Databases in secondary navigator.
Select the relevant target database.
Click the Performance tab.
In the Additional Instance Monitoring Links section, click Search SQL.
Paste the ID of the SQL call into the relevant field with any other choices you may need and then click Search.
Analyze the SQL.
To find and analyze memory leaks, you can use Cloud Control to take and analyze snapshots of the heap.
Analyzing heap requires a large amount of free space in the Oracle Database tablespace being used. As a standard practice, ensure you have five times the size of heap dump file being loaded in the tablespace. Since you know the size of your dump file, make sure that there is adequate space to accommodate the dump file before it is loaded into the database.
To use heap snapshot to analyze memory leaks:
To create a snapshot of the heap for later loading and examination for leaks:
From the Targets menu, choose Targets > Middleware.
The Middleware target home page displays.
Search for the Oracle WebLogic Server domains:
From the Search area, click Advanced Search.
From the Type list, select Java Virtual Machine; deselect the other options.
Click Search.
Click on a Java Virtual Machine with JVM Diagnostics agents deployed. For more information about installing JVM Diagnostics, see the Oracle Enterprise Manager Cloud Control Basic Installation Guide.
The Java Virtual Machine Home page displays.
From the Java Virtual Machine menu, choose Performance Summary.
The Performance Summary page displays.
Review the following metrics for any periods of time where the Warning Thresholds or Critical Thresholds were reached:
|
JVM GC Overhead |
This metric shows the percentage of CPU the JVM is using for garbage collections in relation to total CPU usage including servicing application workload (the lower, the better). This metric and its trending can help determine when the garbage collector is making the CPU spin on garbage collection instead of on application workload. |
|
JVM Heap Usage (%) |
This metric shows the heap utilization for the JVM. This metric provides an indicator of heap size as they fluctuate between garbage collections. |
|
JVM Heap Used After GC |
This metric shows the percent of heap utilization used after garbage collection. This metric and its trend over time can provide a good indication that there is a leak. For example, if the chart trending up while the application load is stable, then it is possible there is a leak. |
If any of the metrics exceed the Warning Thresholds or Critical Thresholds, it could indicate memory is a factor in the JVM performance and availability. It could mean there is a memory leak or that the JVM heap configuration is too small for the application load. If the heap configuration is correct, assume there is a leak and investigate the cause.
If any of the metrics exceed the Warning Thresholds or Critical Thresholds , proceed to Task 2.
To create a snapshot of the heap for later loading and examination for leaks:
From the Java Virtual Machine menu, choose Live Heap Analysis.
The Live Heap Analysis page displays.
Review the top portion of the page to the analyze the heap and the number of objects added to the garbage collector; review the JVM Class Detail table to review the largest-size objects in the heap.
For more information about using this page, see the topic "Viewing the Real-Time Heap Data" in the Cloud Control online help.
To create a snapshot of the heap for later loading and examination for leaks:
On the Live Heap Analysis page, click Create Heap Snapshot.
The Heap Snapshot page displays.
Provide the settings for your environment.
Notice the Heap Snapshot Type under Heap Snapshot Only option enables you to pick either Oracle's JVMD format or a HROFF for use with other tools.For more information about using this page, see the topic "Taking a Heap Snapshot" in the Cloud Control online help.
If you selected Heap Snapshot Only option, click Take Snapshot.
The heap snapshot is generated and the file name in which it is stored is displayed. You can upload the heap snapshot and analyze it using appropriate options from the Heap Snapshots menu.
From the Java Virtual Machine menu, choose Heap Snapshots.
The Available Heap Snapshots page displays.
Select the heap you created from the table, and then click Detail.
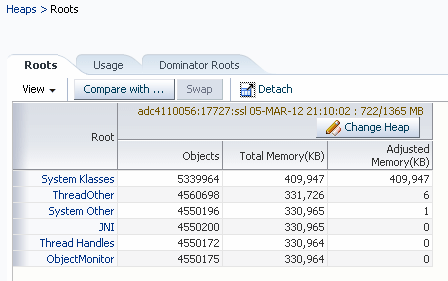
The Heaps > Roots page displays. The Roots tab displays the objects reachable by roots, which are objects that are directly reachable from the JVM itself.

Click a root name to drill down and view the objects that consume a lot of memory.
The Top 40 Objects page displays.
In the Heaps > Roots page, click Compare with to compare the current heap with another previously taken heap dump.
When comparing heaps, load the bigger one first. Otherwise you may see negative deltas.
In the Select a heap record dialog, select the second heap, and then click OK.
Compare both the heaps. Compare the number of objects (Objects) and the occupied memory size (Adjusted Memory) in each heap dump. This measure indicates the objects that are growing over the period of time when the snapshots were taken.
Drill down into the root which had the largest delta in order to find the biggest memory leak.