11g Release 1 (11.1.3)
Part Number E20376-03
Contents
Previous
Next
|
Oracle® Fusion
Applications Compensation Management Implementation Guide 11g Release 1 (11.1.3) Part Number E20376-03 |
Contents |
Previous |
Next |
This chapter contains the following:
Define Total Compensation Statements: Overview
Total Compensation Statement Building Blocks: How They Fit Together
Compensation Items and Sources: Explained
Compensation Category Types: Explained
Total Compensation Categories and Subcategories: Critical Choices
Total Compensation Statement Definitions: Critical Choices
Total Compensation Statement Display Options: Points to Consider
Worked Examples for Define Total Compensation Statements
FAQs for Define Total Compensation Statements
Configure the design, content, and delivery of a compensation statement that includes nontraditional forms of pay such as fringe benefits, cost of benefits, and paid time off, in addition to traditional forms of pay such as base pay and variable compensation.
Application implementors and compensation administrators can:
Define compensation items that represent actual amounts paid to workers or costs incurred by the company and arrange them into categories such as cash compensation, base pay, benefits, or company stock.
Assemble categories into statement definitions.
Display category details on a single page or enable recipients to drill to details in the statement.
Configure optional graphical displays of data, worker instructions, and supplemental information such as compensation policies or benefit plan details.
Define periods for which statement data is valid and customize an optional welcome message for each period.
Configure settings that control statement availability and the default stock price and currency used for estimated values.
Generate new statements, purge unneeded statements, and monitor processes with summary and detailed online reports.
To define total compensation statements, start from the Setup and Maintenance Overview page. Select Navigator - Setup and Maintenance.
Note
Compensation administrators can maintain total compensation statements from the Compensation work area. Select Navigator - Compensation.
To construct a total compensation statement, you create compensation items, attach them to compensation categories, and arrange the categories hierarchically in a statement definition. After specifying the statement period and configuring other display options, you generate the statements and make them available for workers to view.
This figure shows the construction of a total compensation statement definition and how it displays items and categories.
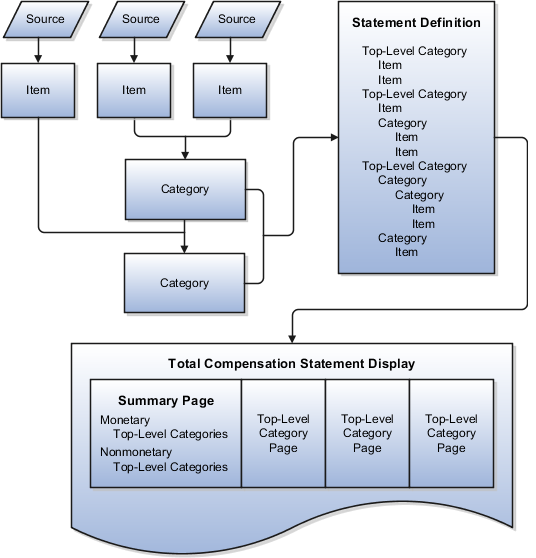
Compensation items are the foundation on which the statement is built. Define compensation items that represent actual amounts paid to workers, costs incurred by the company, or the value of accrued time off, for example. Map each item to the specific source from which the compensation information is retrieved. The sources of compensation information include payroll element entries, payroll balances, and benefit balances. You can also create fast formulas to retrieve compensation from other sources. You can use compensation items across statement definitions.
Arrange compensation items into categories, such as cash compensation, benefits, time off, or stock history, which enable you to display related compensation items together. Compensation categories display information in tables. The category type determines the table columns and the general layout of a category page within the statement. A row in a category table can contain compensation items, or it can contain another category used as a subcategory that contains its own compensation items. You can use compensation categories across statement definitions.
The statement definition acts as a template and determines the layout and content of the generated statement. Add the categories that contain the items you want to include in the statement, and arrange them into a hierarchy. You can nest categories within other categories to create subcategories. Define periods for which statement data is valid and customize an optional welcome message for each period. You can reuse statement definitions by creating new statement periods and then modify the definition for subsequent periods. You can also duplicate a definition as the starting point for other definitions.
Top-level categories in the statement definition appear in the optional summary page and as separate pages in the statement. From each top-level category, viewers can view item details, or drill into items and subcategories, depending on how the category is configured. The statement can also display optional graphs, worker instructions, and supplemental information, such as compensation policies or benefit plan details.
Compensation items are the lowest level of detail on which the total compensation statement is based. Items can hold monetary, nonmonetary, date, or text values. Compensation items must be added to a compensation category to include them in a total compensation statement. You cannot add items to statement definitions directly.
These are significant aspects of compensation items:
Source types
Type of compensation and unit of measure
Estimated values
Rounding
You map compensation items to the source of the compensation to retrieve the compensation information. Compensation items using different source types have slightly different data entry configurations based on the data required for each type.
This table describes the source types and special data entry requirements.
|
Source Type |
Description |
Additional Data Entry Requirements |
|---|---|---|
|
Payroll Element |
Compensation retrieved from payroll elements, such as salary and bonus earnings. |
Legislative Data Group and Input Value |
|
Payroll Balance |
Compensation retrieved from payroll balance records, such as commissions or company-paid taxes. |
Legislative Data Group and Dimension |
|
Benefit Balance |
Compensation entered as a one-time benefit balance, such as data obtained from a legacy compensation system. |
None |
|
Formula |
Create a formula to retrieve compensation information that is not stored in the other predefined source types. |
Type of Compensation, nonmonetary Unit of Measure, and Currency. (Formula unit or currency overrides item definition) |
The compensation item inherits from the source the default type of compensation, such as monetary or nonmonetary, and the monetary currency or nonmonetary unit of measure. In some cases you can override the default compensation type and nonmonetary unit of measure when defining the item.
Note
If a formula that retrieves compensation also specifies currency or nonmonetary unit of measure, the formula currency or unit overrides the currency or unit specified in the item definition.
For each item, you can select the Estimated amount option to indicate that this compensation is not the actual amount paid. In the statement definition, you can specify whether to display the estimated amount indicator for amounts designated as estimated.
You can specify how to round nonmonetary amounts.
The compensation category type determines the table columns and general layout of the category page in the total compensation statement, as well as whether the category can include subcategories within it.
These are the category types:
Benefits
Cash Compensation
Savings and Retirement
Time Off
Stock History
Custom
Other
The Benefits, Cash Compensation, Savings and Retirement, and Other categories share the same basic category structure. These category types permit you to add compensation items as well as categories nested within the category as subcategories. By default, the category table display includes a worker contribution column and an employer contribution column, as well as a description. You can hide columns that do not apply.
The Time Off category does not permit you to add categories as subcategories. It includes columns for the type of time off, monetary value of the time off, and accrued balance. You can edit column labels and configure each row name in the category table to be a link to time off information, such as a holiday schedule for paid holidays.
The Stock History category type displays up to 27 columns of data from the database table that stores workers' stock details. When you configure the category, you can select which types of stock to include in the category, such as incentive stock options, non-qualified stock options, restricted stock, and so on. By default, many of the columns are hidden or only visible in the statement optionally, if the worker selects the column in the statement View menu. You can alter which columns are hidden or optionally available in the statement, and edit the column labels.
If you select the Custom category type, you must also specify the number of columns, up to five, that you want to include in the category, and then configure the column labels and select compensation items for the table rows. For example, you might use the custom category type to display information about commissions by including columns such as sales target, units sold, percentage over target, percentage under target, and commission amount. You cannot add subcategories to the Custom category type.
The Other category type shares the same basic structure as the Cash Compensation or Benefits category type, but you can use it for any type of compensation.
Group related compensation together into compensation categories for display in total compensation statements. When planning how to group compensation items and categories for display, you must consider compatibility of the grouped compensation and some display options. The following factors affect your ability to add compensation items or other categories to a category and how you can display the category in the statement:
Category type
Contribution type and unit of measure
Level of detail
When you create a new category, you first select the category type. The category type determines the table columns and general layout of the page in the statement. The category types are Benefits, Cash Compensation, Stock History, Custom, Savings and Retirement, Time Off, and Other. You can add subcategories only to categories of Benefits, Cash Compensation, Savings and Retirement, or Other category type.
Important
You can use a category in more than one statement. Once you use a category in any statement, you cannot change the category type.
A category's monetary or nonmonetary contribution type and nonmonetary unit of measure are determined by the contribution type and unit of measure of the items or subcategories added.
All items and subcategories within a nonmonetary subcategory must share the same unit of measure.
When you create a category, you specify how you want to display the category details in the statement.
Choose one of these levels of detail for the category:
Provide links from a high-level category page that drill down to specific details for each item or subcategory row in the category.
For example, you can create a Benefits category that displays high-level information for different health benefits such as medical, dental, vision, and life insurance. To see the details of each row in the category, such as medical, viewers can drill into the row and access a separate details page.
Display the full detail of the category's content on a single page in the statement.
For example, you can create a Bonus category that displays the amount of different bonuses, such as new hire and quarterly, as rows on the category page.
When deciding on the level of detail display option, consider the following effects of showing all details on a single page:
You cannot add subcategories to the Benefits, Cash Compensation, Savings and Retirement, or Other categories, which would be permitted if the level of detail enabled drilling to see details.
The name column does not show in the statement for rows in the category.
You cannot hide all columns in the category.
This option is not recommended for recurring information.
Consider these statement elements and options when determining how many different total compensation statement definitions you require and planning the presentation of content in each:
Compensation items and categories
Statement audience
Statement periods
Statement duplication
Statement reuse
The total compensation statement definition comprises compensation items added to compensation categories to build the structure of the statement. You can define these building block components first and then associate them hierarchically to build the statement definition, or you can create the item and category components as you build the statement hierarchy. Because you can reuse items and categories across multiple statements, you might find it more efficient to create the items and categories before creating statement definitions.
The total compensation statement can report compensation across countries. You can add compensation items with sources, such as payroll elements, that belong to different legislative data groups.
When you generate statements for a statement definition, you can select the statement audience at run time using the following population filter parameters: business unit, benefits group, legal employer, country, a person selection formula that you define, or a single person that you select.
In addition, you might want to configure different statement definitions for different statement audiences within the populations determined by the run time population filters. For example, within a business unit, you might create separate statement definitions for individual contributors and executive level workers. Accomplish this by creating eligibility profiles that differentiate between individual contributors and executive workers, and attach each to the corresponding statement definition.
Configure statements to cover any period of time by specifying start and end dates. You can create multiple periods at one time. For each statement period, further specify:
An optional statement period display name
For example, name the period 2011 Annual Statement rather than the default display of start and end date.
The date that statements are available to workers
The exchange rate date for currency conversions
An optional welcome message
You can duplicate a statement definition and edit it to create a new definition. For example, to create the definition for executive level workers, you could duplicate the statement definition for individual contributors, add additional compensation categories or items, and associate a different eligibility profile.
You do not need to recreate statement definitions for each year or period. You can reuse an existing statement definition by adding new periods. You might also want to update the welcome message, add or edit the items and categories included, or modify the display of graphs and tables.
You have many options to control the layout and display of tables and categories in total compensation statements, as well as additional options for displaying graphs, descriptive text, and supplemental information. In general, you configure display options for category detail pages during category setup. During statement definition setup, you configure top-level categories and the summary page.
This table lists and compares the display options available when creating or editing compensation categories and compensation statement definitions.
|
Display Option |
Category Setup |
Statement Definition Setup |
|---|---|---|
|
Hide table columns |
Yes |
Yes: summary page columns |
|
Rename table columns |
Yes |
Yes: top-level categories only |
|
Configure display of zero values |
Yes |
Yes: top-level categories only |
|
Configure graph display |
Yes |
Yes: in summary page |
|
Add descriptive text |
Yes |
Yes: in summary page |
|
Add supplemental text |
Yes |
Yes: in summary page |
|
Change vertical display order |
Yes |
Yes: in summary page |
|
Hide regions for graphs or descriptions |
Yes |
Yes: in summary page |
|
Exclude category from statement summary |
No |
Yes: top-level categories only |
|
Hide or show estimated amount indicator |
No |
Yes |
|
Include and hide welcome message |
No |
Yes |
|
Include and hide statement summary page |
No |
Yes |
When you edit the column properties to hide a column in the statement, the data that the column would display is not included in summary or detail tables or graphs.
Here are points to consider when hiding columns:
You can hide unused or not applicable columns, such as the worker contribution column in a cash compensation category.
You cannot hide all columns in a category if you configure the category level of details to show all details on a single category overview page.
You can hide description columns. However, if you choose to show a category's row in the statement even when it contains only zero values, you should show at least the description column and enter a description, otherwise viewers will see a row of zeros with no associated description.
When you design categories for a statement, decide how to handle rows for categories, subcategories, and items for which a worker has no values to display during the statement period, such as when a worker has not received any stock options during the period or a worker is not participating in a compensation or benefit plan.
This table describes the zero value display options.
|
Statement Element |
Display Options When All Contribution Values are Zero |
|---|---|
|
Category and item rows |
Display the row in the statement or hide it. |
|
Subcategory rows |
Display or hide the row in the high-level category page and permit or prevent drilling to the subcategory detail page. |
|
Top-level categories |
Display or hide the top-level category page in the statement. |
If you choose to display the row or category page with zero values, you can optionally compose a message to display in the statement that explains the lack of values or calls attention to missed opportunities, such as participation in a stock purchase plan.
You can display up to two graphs for each category. If you include a summary page in the statement, you can also include up to two graphs each in the Monetary and Nonmonetary sections of the summary.
For each graph that you choose to display, you must specify:
Graph type: Pie chart or various types of bar chart
Columns included in the graph: Worker contributions, company contributions, or both.
Note
A graph cannot include columns containing text, dates, more than one nonmonetary unit of measure, or a combination of monetary and nonmonetary values. For example, a graph that mixes shares of stock, a company car, and fitness membership would not provide clear information.
When creating compensation items, you can identify whether the item amounts are estimates. At the statement level, you specify whether to display or hide the indicator that visually denotes amounts as estimated.
For each statement period, you can compose an optional welcome message, personalized with each worker's name, that uses rich text and includes hyperlinks. If included, the welcome message is the first page the worker sees in the statement.
The optional statement summary page provides workers with a high-level view of their total compensation in graphs and tables. The summary displays summed totals of the top-level categories included in monetary and nonmonetary sections. Viewers can drill down to detailed category pages from the summary page or from the navigation links in the regional area.
The summary page comprises three optional sections that you can configure.
Monetary section and nonmonetary section, each containing section-level descriptive text, graphs, and tables
Summary page descriptive text that can include rich text formatting and hyperlinks
Summary page supplemental information, such as hyperlinks to company policies and resources, displayed in a separate window
Note
If you include a graph in the nonmonetary section, all top-level categories in the nonmonetary summary should share the same unit of measure. You can exclude individual top-level categories from the summary.
This example demonstrates how to create a bonus category that includes a profit sharing bonus, a new hire bonus, and a quarterly bonus. The new hire and quarterly bonus items already exist and are reused in this category.
The following table summarizes key decisions for the Profit Sharing compensation item in this scenario.
|
Decision to Consider |
Item in This Example |
|---|---|
|
What compensation does the item represent? |
Profit sharing bonus |
|
What is the source type? |
Payroll element |
|
What is the legislative data group? |
USA |
The following table summarizes key decisions for the category in this scenario.
|
Decision to Consider |
Category in This Example |
|---|---|
|
What is the category type? |
Cash Compensation |
|
Display category details in the statement at what level? |
Viewers see all details on one page. |
|
Add items? (Describe) |
Yes: Profit sharing bonus, new hire bonus, and quarterly bonus. |
|
Add other categories as subcategories? Describe |
No |
|
Display graphs? (No or Yes?) One or two? What type? |
Yes. Two: Bar and stacked bar. |
|
Hide or edit any columns in the category? |
Hide worker contributions because this is a cash compensation category. Edit company contribution column name to make it familiar to workers. |
|
Display the row if values are zero in the period? |
No |
Create a profit sharing bonus item, then create a bonus category and attach the item you created along with other existing bonus items and configure display options. Use the default values except where indicated.
New Hire Bonus
Quarterly Bonus
Use the default values except where indicated.
|
Field |
Value |
|---|---|
|
Item Name |
Profit Sharing Bonus |
|
Source Type |
Element entry |
|
Legislative Data Group |
USA |
|
Payroll Element |
Profit Sharing Bonus |
|
Input Value |
Pay Value |
|
Field |
Value |
|---|---|
|
Name |
Bonus |
|
Category Type |
Cash Compensation |
|
Name |
Description |
Company Contribution (Items) |
|---|---|---|
|
Profit Sharing |
Profit Sharing Bonus |
Profit Sharing Bonus |
|
New Hire |
New Hire Bonus |
New Hire Bonus |
|
Quarterly |
Quarterly Bonus |
Quarterly Bonus |
|
Field |
Value for the First Graph |
Value for the Second Graph |
|---|---|---|
|
Graph Title |
Your Bonuses |
How Your Bonuses Add Up |
|
Graph Type |
Bar |
Bar - stacked |
|
Graph Items |
Amount |
Amount |
This example demonstrates how to create a benefits category that includes medical, dental, vision, disability insurance, and life insurance.
The following table summarizes key decisions for the compensation items in this scenario.
|
Decision to Consider |
First Item |
Second Item |
|---|---|---|
|
What compensation does the item represent? |
Worker contribution for medical benefit |
Company contribution for medical benefit |
|
What is the source type? |
Payroll element |
Payroll element |
|
What is the legislative data group? |
USA |
USA |
The following table summarizes key decisions for the category in this scenario.
|
Decision to Consider |
Category in This Example |
|---|---|
|
What is the category type? |
Benefits |
|
Display category details in the statement at what level? |
Display details of item rows on separate pages that viewers drill to for details. |
|
Add items? (Describe) |
Yes: Both worker and company contributions for medical, dental, vision, disability insurance, and life insurance benefits. |
|
Add other categories as subcategories? Describe |
No |
|
Display graphs? (No or Yes?) One or two? What type? |
Yes. Two: Stacked bar and pie chart. |
|
Hide or edit any columns in the category? |
No |
|
Display the row if values are zero in the period? |
No |
Create items for medical insurance, then create a benefits category and attach the items you created along with eight existing benefits items and configure display options. Use the default values except where indicated.
Medical Worker Contribution
Medical Company Contribution
Dental Worker Contribution
Dental Company Contribution
Vision Worker Contribution
Vision Company Contribution
Disability Worker Contribution
Disability Company Contribution
Life Insurance Worker Contribution
Life Insurance Company Contribution
Use the default values except where indicated.
|
Field |
Value |
|---|---|
|
Item Name |
Medical Worker Contribution |
|
Source Type |
Element entry |
|
Legislative Data Group |
USA |
|
Payroll Element |
Medical Worker Contribution |
|
Input Value |
Pay Value |
|
Field |
Value |
|---|---|
|
Item Name |
Medical Company Contribution |
|
Source Type |
Element entry |
|
Legislative Data Group |
USA |
|
Payroll Element |
Medical Company Contribution |
|
Input Value |
Pay Value |
|
Field |
Value |
|---|---|
|
Name |
Benefits |
|
Category Type |
Benefits |
|
Name |
Description |
Your Contribution (Items) |
Company Contribution (Items) |
|---|---|---|---|
|
Medical |
Amounts reflect your coverage. |
Medical Worker Contribution |
Medical Company Contribution |
|
Dental |
Amounts reflect your coverage. |
Dental Worker Contribution |
Dental Company Contribution |
|
Vision |
Amounts reflect your coverage. |
Vision Worker Contribution |
Vision Company Contribution |
|
Disability Insurance |
LTD provides income protection. |
Disability Worker Contribution |
Disability Company Contribution |
|
Life Insurance |
Life insurance is a core benefit. |
Life Insurance Worker Contribution |
Life Insurance Company Contribution |
|
Field |
Value for the First Graph |
Value for the Second Graph |
|---|---|---|
|
Graph Title |
Employee Versus Company Contributions |
Total Contribution Comparison |
|
Graph Type |
Bar |
Pie |
|
Graph Items |
Your Contribution, Company Contribution |
Your Contribution, Company Contribution |
This example demonstrates how to create a Commissions category using the Custom category type.
The following table summarizes key decisions for the category in this scenario.
|
Decision to Consider |
Category in This Example |
|---|---|
|
What is the category type? |
Custom |
|
Display category details in the statement at what level? |
Viewers see all details on one page. |
|
Add items? (Describe) |
Yes: Sales target, sales revenue, and commissions items for year end. |
|
Add other categories as subcategories? Describe |
No |
|
Display graphs? (No or Yes?) One or two? What type? |
Yes. Two bar charts, one for revenue generated and one for commissions earned. |
|
Hide or edit any columns in the category? |
Edit column labels. |
|
Display the row if values are zero in the period? |
No |
Create a Custom category, attach existing compensation items, and configure display options. Use the default values except where indicated.
Sales Target Year End
Sales Revenue Year End
Commission Year End
|
Field |
Value |
|---|---|
|
Name |
Commissions |
|
Category Type |
Custom |
|
Number of Item Columns |
3 |
|
Name |
Description |
Sales Target (Item) |
Sales Revenue (Item) |
Commission (Item) |
|---|---|---|---|---|
|
Row 1 |
Year End Activity |
Sales Target Year End |
Sales Revenue Year End |
Commission Year End |
Note
The Name column does not show in the statement when the level of detail is configured to display all details on a single page.
|
Field |
Value for the First Graph |
Value for the Second Graph |
|---|---|---|
|
Graph Title |
Revenue Generated |
Commissions Earned |
|
Graph Type |
Bar |
Bar |
|
Graph Items |
Sales Revenue |
Commissions |
This example demonstrates how to create a stock history category for nonqualified stock options with vesting information.
The following table summarizes key decisions for the category in this scenario.
|
Decision to Consider |
Category in This Example |
|---|---|
|
What is the category type? |
Stock History |
|
Display category details in the statement at what level? |
Viewers see all details on one page. |
|
Add items? (Describe) |
Not applicable |
|
Add other categories as subcategories? Describe |
Not applicable |
|
Display graphs? (No or Yes?) One or two? What type? |
Yes. One: Bar. |
|
Hide or edit any columns in the category? |
Accept most default column visibility settings. Make some adjustments to visibility of vested share columns and grant number. Edit some column labels for display on the statement. |
|
Display the row if values are zero in the period? |
Not applicable |
Create a stock history category and configure column visibility and graphs.
Note
The Stock Details table must contain stock data.
|
Field |
Value |
|---|---|
|
Name |
Stock History |
|
Category Type |
Stock History |
|
Sequence |
Column Type |
Column Label |
Available for Display |
|---|---|---|---|
|
1 |
Original Grant Date |
Grant Date |
(Use default) |
|
3 |
Grant Number |
(Use default) |
Select |
|
10 |
Original Value at Grant |
Grant Value |
(Use default) |
|
16 |
Estimated Market Value of Total Shares |
Estimated Market Value |
(Use default) |
|
17 |
Vested Shares |
(Use default) |
Select |
|
18 |
Exercised Shares |
(Use default) |
Select |
|
20 |
Estimated Gain from Vested Shares |
(Use default) |
Deselect |
|
Field |
Value for the First Graph |
|---|---|
|
Graph Title |
Vested Versus Unvested Shares |
|
Graph Type |
Bar |
|
Nonmonetary Graph Items |
Vested Shares, Unvested Shares |
This example demonstrates how to create, generate, and view a total compensation statement that contains two top-level categories, one for cash compensation and one for stock. The statement definition is for individual contributors whose salaries are quoted on an annual basis. The categories added as subcategories have already been created for other statement definitions and are reused in this definition.
The following table summarizes key decisions for the compensation item in this scenario.
|
Decision to Consider |
Item in This Example |
|---|---|
|
What compensation does the item represent? |
Base pay for exempt workers with annual salary |
|
What is the source type? |
Payroll element |
|
What is the legislative data group? |
USA |
The following table summarizes key decisions for the categories in this scenario.
|
Decision to Consider |
Cash Compensation Category |
Stock Category |
|---|---|---|
|
What is the category type? |
Cash Compensation |
Other |
|
Display category details in the statement at what level? |
Display details of item and subcatgory rows on separate pages that viewers drill to for details. |
Display details of item and subcatgory rows on separate pages that viewers drill to for details. |
|
Add items? (Describe) |
Yes: Base pay for exempt workers |
Not directly, only through subcategories. |
|
Add other categories as subcategories? Describe |
Yes. One: Bonuses Exempts |
Yes. Two: ESPP Exempts and Stock History Exempts |
|
Display graphs? (No or Yes?) One or two? What type? |
Yes. Two: Bar and stacked bar. |
No |
|
Hide or edit any columns in the category? |
Hide worker contributions because this is a cash compensation category. Edit subcategory names to make them familiar to workers. |
Edit subcategory names to make them familiar to workers. |
|
Display the row if values are zero in the period? |
No |
Display the Employee Stock Purchase Plan row but prevent drilling to details. |
The following table summarizes key decisions for the statement definition in this scenario.
|
Decision to Consider |
Statement Definition in This Example |
|---|---|
|
Include which top-level categories? |
Cash Compensation and Stock |
|
What is the statement period? |
Calendar year 2010 Also create a second annual period to be ready for the next year. |
|
Include welcome message? |
Yes. Address recipients by first name. |
|
Include summary page? |
Yes |
|
What is the statement audience for eligibility? |
Individual contributors whose salaries are quoted on an annual basis |
|
What is the population for statement generation? |
Legal employer: Infusion USA |
Create a new total compensation statement definition using a new item and two new categories that you create, assembled with some existing categories that contain items. Generate and view statements using the new definition.
Create a compensation item.
Create a cash compensation category and add the item and a subcategory.
Create a stock category and add subcategories.
Create a statement definition.
Configure optional eligibility and statement summary page.
Generate and view statements.
Bonuses Exempts
ESPP Exempts
Stock History
Use the default values except where indicated.
|
Field |
Value |
|---|---|
|
Item Name |
Base Pay Exempts |
|
Source Type |
Element entry |
|
Legislative Data Group |
USA |
|
Payroll Element |
Base Pay Exempts |
|
Input Value |
Pay Value |
Create a cash compensation category and attach the base pay item you created along with two existing cash categories with items. Use the default values except where indicated.
|
Field |
Value |
|---|---|
|
Name |
Cash Compensation |
|
Category Type |
Cash Compensation |
|
Column |
Value |
|---|---|
|
Name |
Salary |
|
Description |
Base pay amounts |
|
Company Contribution |
Base Pay Exempts |
|
Column |
Value |
|---|---|
|
Name |
Bonuses |
|
Description |
Lump sum compensation amounts |
|
Field |
Value for Graph 1 |
Value for Graph 2 |
|---|---|---|
|
Graph Title |
Your Cash Awards |
Total Cash Compensation |
|
Graph Type |
Bar |
Bar - stacked |
|
Graph Items |
Amount |
Amount |
Create a stock category and attach two existing stock categories with items. Use the default values except where indicated.
|
Field |
Value |
|---|---|
|
Category Name |
Stock Awards |
|
Category Type |
Other |
|
Column |
Stock History Category |
ESPP Category |
|---|---|---|
|
Name |
Stock Options |
Employee Stock Purchase Plan |
|
Field |
Value |
|---|---|
|
Zero Contributions Display |
Display the row and prevent drilling to subcategory |
|
Alert Message |
Enter any text to display when workers have no stock to display. |
Create a statement definition and configure the statement table display, periods, and welcome message. Use the default values except where indicated.
|
Field |
Value |
|---|---|
|
Start Date |
01-Jan-2010 |
|
End Date |
31-Dec-2010 |
|
Date Available to Workers |
01-Mar-2010 |
|
Currency Conversion Date |
31-Dec-2010 |
|
Number of Periods |
2 |
|
Field |
Value for the First Graph |
Value for the Second Graph |
|---|---|---|
|
Graph Title |
Your Total Compensation |
How Your Compensation Adds Up |
|
Graph Type |
Bar |
Bar - stacked |
|
Graph Items |
Company Contributions |
Company Contributions |
Update global settings, run the process to generate the statements, check the process reports, and view workers' generated statements. Use the default values except where indicated.
|
Field |
Value |
|---|---|
|
Default Stock Price |
35 |
|
Currency |
US Dollar |
|
Field |
Value |
|---|---|
|
Statement Definition Name |
2010 Annual Statement |
|
Statement Period |
2010 Annual Statement |
|
Legal Employer |
Infusion USA |
Note
You must have the Compensation Manager role to view statements.
Select the category or item row, and then select the zero value display option in the Actions menu. The Display Zero Rows column shows the current setting for each category. On the Edit Statement Definition page you can edit only the top-level category. You must edit subcategory and item rows on the Edit Compensation Categories page.
Click the Column Properties button and select the column from the menu. Update the option to display the column in the statement.
On the summary page you can edit only summary table column properties. You must edit each individual category's column properties on the Edit Compensation Category page.
First select the statement definition and click Edit. On the Periods tab, select the icon in the Welcome Message column. Edit the Do not display welcome message option.
First select the statement definition and click Edit. On the Periods tab, select the edit icon in the Welcome Message column.
If the item is in use in a compensation category, it cannot be deleted and you cannot edit some attributes, such as the type of compensation and nonmonetary unit of measure.
More than one administrator might have access to these settings because this stock price and currency information is used to display stock in compensation history as well as when managing workforce compensation or generating total compensation statements.
Yes. You can reuse an existing statement definition by adding new periods. You might also want to update the welcome message, add or edit the items and categories included, and hide or update the display of graphs, descriptive text, and supplementary information.
Yes. You can correct the statement definition and regenerate the statements, which makes the newer version available to workers.
|
Copyright © 2011, Oracle and/or its affiliates. All rights reserved. Legal Notices |
|