| Oracle® Application Testing Suite Getting Started Guide Version 9.20 Part Number E15487-04 |
|
|
View PDF |
| Oracle® Application Testing Suite Getting Started Guide Version 9.20 Part Number E15487-04 |
|
|
View PDF |
This chapter explains how to get started using Oracle Application Testing Suite. It explains how to install and start the applications, and the features of the main windows.
To install Oracle Application Testing Suite:
Go to: http://www.oracle.com/technology/software/products/app-testing/index.html.
Note:
See the Oracle Application Testing Suite Release Notes for additional information about the download files and the installation procedure.Download the Oracle Application Testing Suite product from the Oracle Web site and save it to a temporary directory on your hard disk.
Unzip the download file and then run setup.bat to install Oracle Application Testing Suite.
Follow the setup instructions to install the Oracle Application Testing Suite and OpenScript.
During the Oracle Application Testing Suite installation, you will be required to enter a default password to be used with Oracle Application Testing Suite products. Remember this password. It will be required to log in to the Administrator, Oracle Load Testing, and Oracle Test Manager.
Select applications from the Oracle Application Testing Suite start menu to start the user interface for specific products.
The installation creates a default Administrator user name in the Oracle Application Testing Suite database. The first time you log into the Administrator, Oracle Load Testing, or Oracle Test Manager, enter the username administrator and the password you defined during the installation. You can use the Oracle Application Testing Suite Administrator to change the default users and customize the usernames and passwords for Oracle Application Testing Suite users.
The Oracle Application Testing Suite Administrator is where you customize user access for Oracle Load Testing and Oracle Test Manager. For Oracle Test Manager, you can also customize roles, projects, and fields.
Figure 2-1 Oracle Application Testing Suite Administrator Main Window
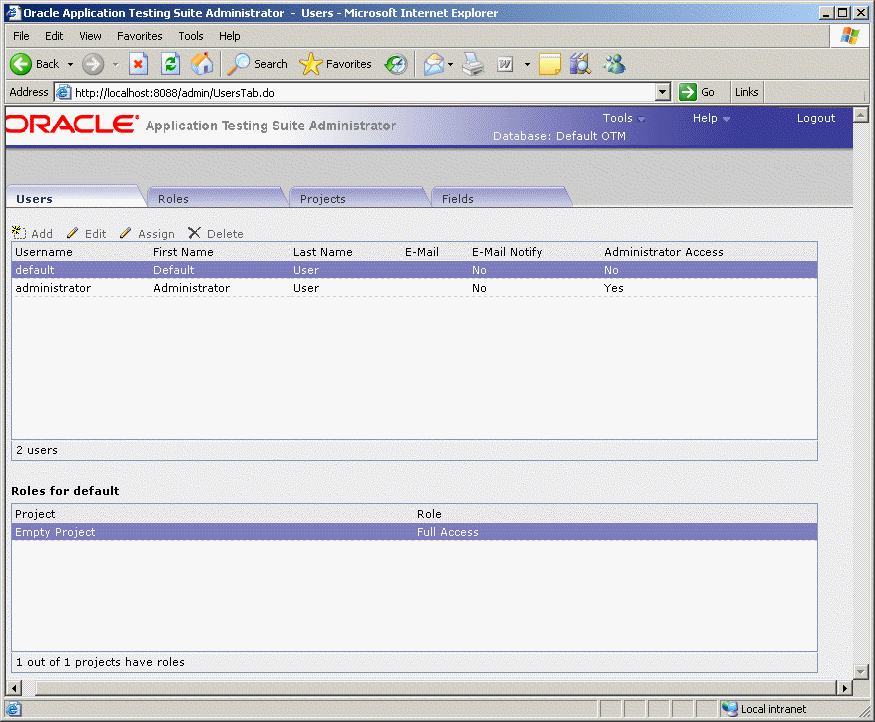
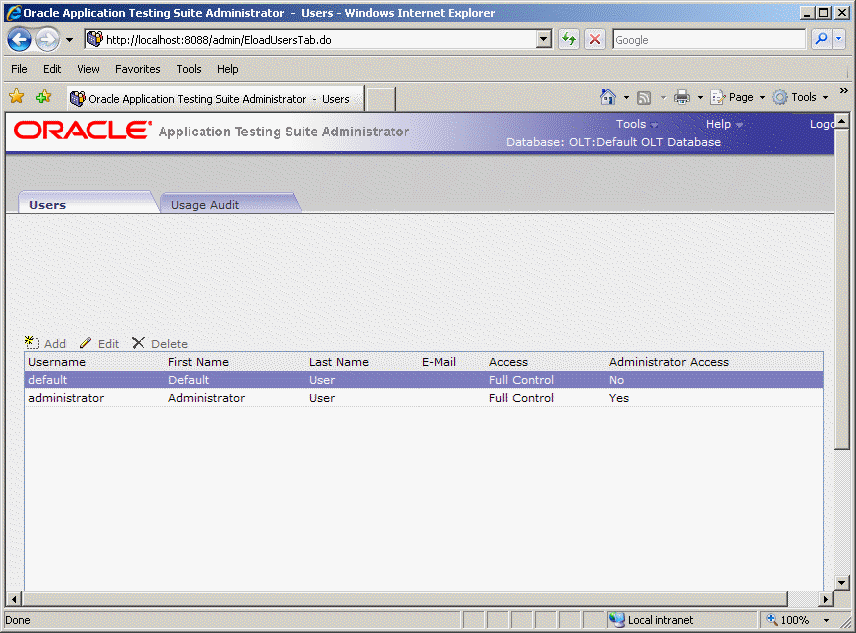
When you log into the Administrator and select an Oracle Load Testing database, only the Users and Usage Audit tabs appear. When you log into the Administrator and select an Oracle Test Manager database, the Users, Roles, Projects, and Fields tabs appear.
The Users tab is where you add, delete, and configure users for Oracle Load Testing and Oracle Test Manager for Applications.
For Oracle Load Testing databases, the Users tab lets you add, edit, and delete users.
Figure 2-2 Users Tab for Oracle Load Testing Users
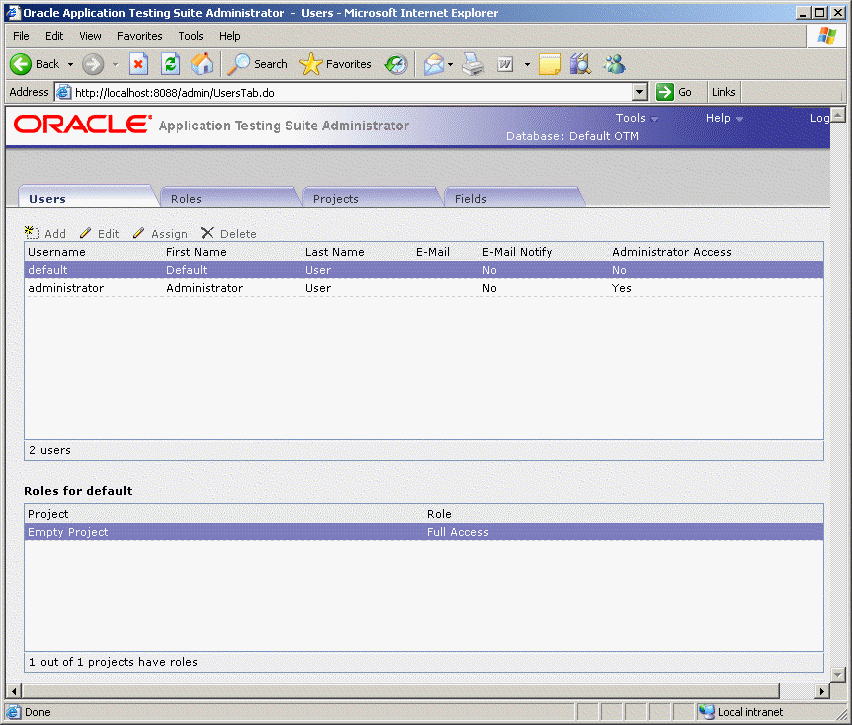
For Oracle Test Manager databases, the Users tab lets you add, edit, and delete users, and assign specific projects to users.
Figure 2-3 Users Tab for Oracle Test Manager Users
The Users tabs can have the following options:
Add - displays the Add User dialog box for adding a new user.
Edit - displays the Edit User dialog box for the selected user. You can change the user's name, username, or password.
Assign - displays the Edit Role dialog box for assigning roles to the selected user for the selected projects.
Delete - deletes the selected user.
Username - displays the name the user will use to log on. Click the column header to sort users in ascending order by this field.
First Name - displays the user's first name. Click the column header to sort users in ascending order by this field.
Last Name - displays the user's last name. Click the column header to sort users in ascending order by this field.
E-mail - displays the user's email address. When Enable E-mail notification is selected for the user, the user will receive email notifications when items are created, or when the owner or assigned to field is changed for issues. Click the column header to sort users in ascending order by this field.
E-mail Notify - indicates whether the user will receive email notifications. Click the column header to sort users in ascending order by this field.
Administrator Access - indicates whether the user can access the Oracle Test Manager Administrator.
Active - this column is only displayed when named user licenses are being used. Indicates whether the user is active, that is, allowed to log in using a named user license.
Roles for <user> - displays the roles assigned to the selected user for each project in the database.
Project - displays a list of the projects in the database.
Role - displays the role of the selected user for the project.
The Usage Audit tab is where you review and audit the load testing sessions stored in the Oracle Load Testing database.
Figure 2-4 Usage Audit Tab for Oracle Load Testing Users
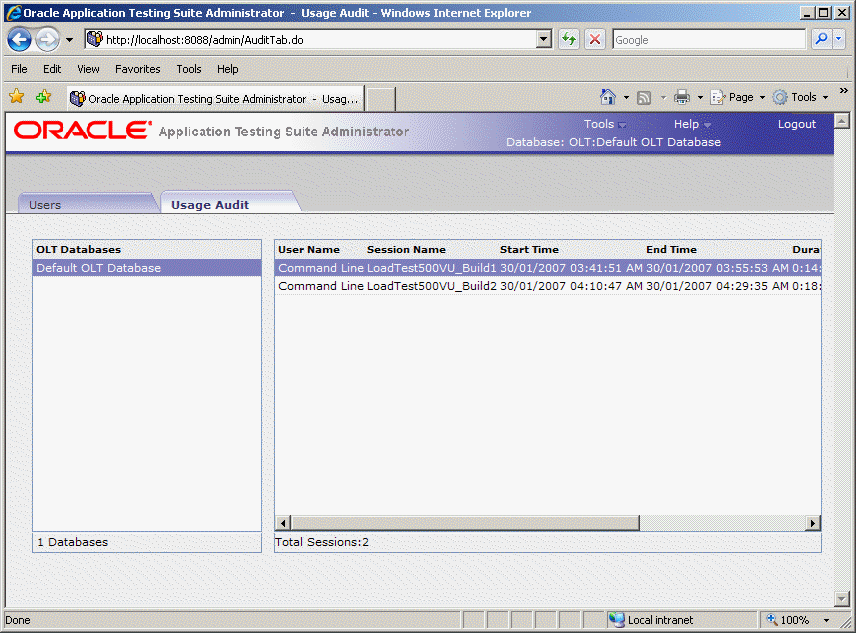
The Usage Audit tab has the following options:
OLT Databases - lists the installed Oracle Load Testing Databases available for auditing.
User Name -shows the name of the user who ran the load test. "Anonymous" indicates the login feature was disabled for the instance of Oracle Load Testing that ran the test and there is no username associated with the test. "Command Line" indicates the load test ran from the command line interface.
Session Name - shows the name of the load testing session.
Start Time - shows the start date and time for the load testing session.
End Time - shows the end date and time for the load testing session.
Duration (HH:MM:SS) - shows the duration of the load testing session in hours, minutes, and seconds.
Machine Name - shows the name of the machine on which the load testing session was run.
Max VU Count - shows the maximum count of Virtual Users that were run for the load testing session.
The Roles tab is where you configure roles. Roles determine the read, write, delete, and execute permissions for users in projects. Once roles are created, you assign them to users for each project that you want them to have access to. A user's role can differ from project to project. Click Assign on either the Projects tab or Users tab to assign roles.
Figure 2-5 Roles Tab for Oracle Test Manager Users
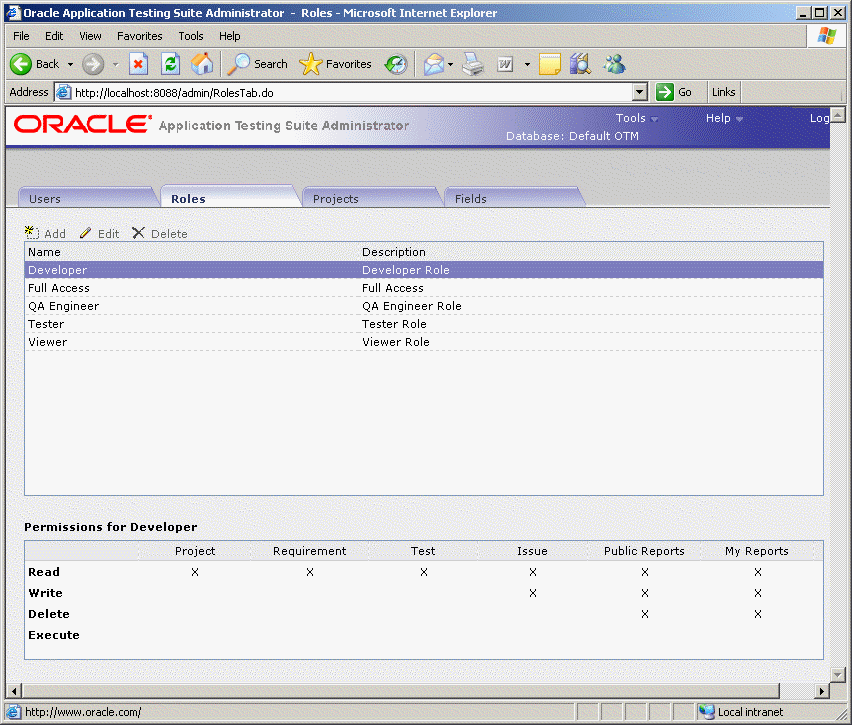
The Roles tab has the following options:
Add - displays the Add Role dialog box for adding a role.
Edit - displays the Edit Role dialog box for editing the selected role.
Delete - deletes the selected role. If a role is in use, you will be asked to assign another role to users assigned to this role.
Permissions for <role> - displays the read, write, delete, and execute permissions for this role for projects, requirements, tests, and issues.
Project - displays the read, write, and delete permissions for projects for users assigned to this role.
Requirement- displays the read, write, and delete permissions for requirements for users assigned to this role.
Test - displays the read, write, delete, and execute permissions for tests for users assigned to this role.
Issue - displays the read, write, and delete permissions for issues for users assigned to this role.
Public Reports - displays the read, write, and delete permissions for public reports assigned to this role.
My Reports - displays the read, write, and delete permissions for reports assigned to this role.
The Projects tab is where you maintain projects.
Figure 2-6 Projects Tab for Oracle Test Manager Users
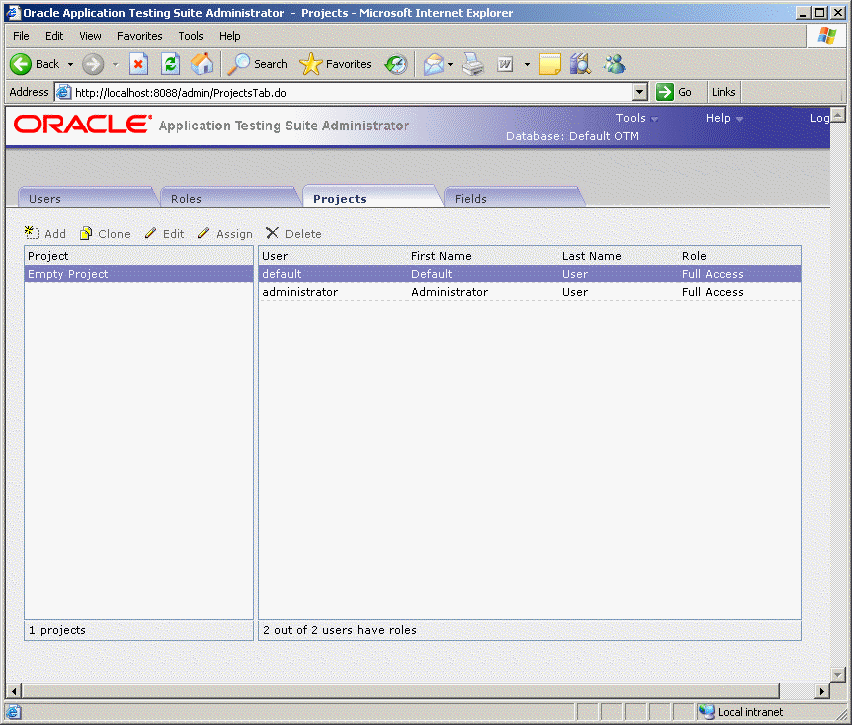
The Projects tab has the following options:
Add- displays the Add Project dialog box for adding a new project.
Clone - displays the Clone Project dialog box for duplicating the selected project. When you clone a project, user roles are the same as the original project.
Edit - displays the Edit Project dialog box for changing the name of the selected project.
Assign - displays the Edit Role dialog box for assigning roles to users for the selected project(s).
Delete - deletes the selected project.
Project - displays a list of projects in the database.
User - displays the users in the database.
First Name - displays the user's first name.
Last Name - displays the user's last name.
Role - displays the users' roles in the selected database.
The Fields tab is where you customize both default and custom fields. These fields are used in Oracle Test Manager for maintaining details about requirements, tests, issues, and test runs.
Figure 2-7 Fields Tab for Oracle Test Manager Users
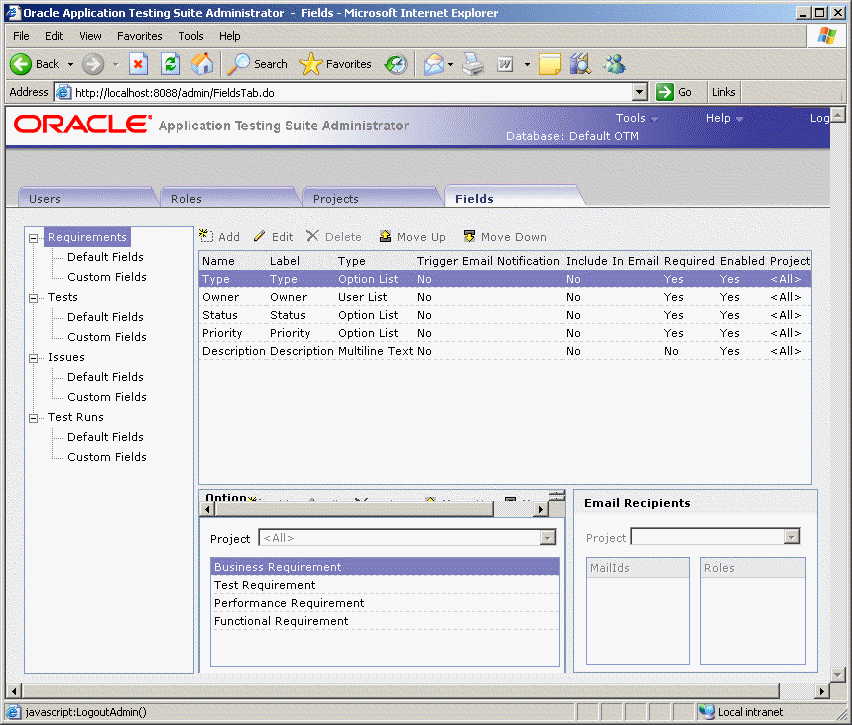
The Fields tab has the following options:
<Field List> - lists the categories and types of fields that you can customize. The categories are:
Requirements - fields that pertain to requirements that appear in the Add/Edit Requirements dialog boxes and are displayed in the right pane.
Tests - fields that pertain to tests that appear in the Add/Edit Tests dialog boxes and are displayed in the right pane.
Issues - fields that pertain to issues that appear in the Add/Edit Issues dialog boxes and are displayed in the right pane.
Test Runs - fields that pertain to test runs that appear in the Run Test dialog box and are displayed in the Result Parameters section of the right pane when you click the run date of a test in the Run History section.
Each category has two types of fields:
Default Fields - these are the fields that are shipped with the product. You can add and delete options and change the labels.
Custom Fields - these are user-created fields. These fields are used for entering information in Oracle Test Manager. They are added to the input and edit dialog boxes for requirements, tests, and issues. They are displayed in the right pane with the default fields, and they can be used for grouping and reporting.
Name - displays the field name.
Label - displays the label displayed in Oracle Test Manager.
Type - displays the type of field. The options are:
Option List - lets you select an option from a list.
Option List/Text - lets you select an option from a list or enter text.
User List - creates a list of the users in the database and lets you select one.
Text - lets you enter one line of text.
Multiline Text - lets you enter multiple lines of text.
Multiline/Append - creates a multiline text field and when editing, lets you choose to append new text to existing text. If you choose to append, the date and user name are automatically added.
Heading - lets you create a heading for grouping custom fields. The heading is for display purposes only in the right-hand pane of Oracle Test Manager.
Trigger Email Notification - indicates whether an email will be sent to the configured recipients when this field changes.
Include In Email - indicates whether the field should be included in email.
Required - indicates whether the field is required, that is, data must be entered when the requirement, test, or issue is created.
Enabled - indicates whether the field is being used in Oracle Test Manager.
Project - indicates the project to which this field applies.
Add - displays the Add Field dialog box for adding a custom field.
Edit - displays the Edit Field dialog box for the selected custom field.
Delete - deletes the selected custom field.
Move Up - moves the selected field up one place.
Move Down - moves the selected field down one place.
Option Lists - lets you maintain the options for the selected field if the field is an option list type of field.
Add - displays the Add Option dialog box for adding an option to the selected field.
Edit - displays the Edit Option dialog box for renaming the selected option.
Delete - deletes the selected option.
Move Up - moves the selected option up one place.
Move Down - moves the selected option down one place.
Project - lets you select the project to which the options apply. This field is only available when you select the Project Specific Options check box in the Add Custom field dialog box for this field. When this check box is selected you can add options specific to each project; otherwise, all projects will have the same options.
Email Recipients - lists the roles and/or email addresses of the people that will receive an email when the selected field changes.
Project - select the project for which you want to display the email recipients.
MailIds - lists the email addresses to which email will be sent when the field changes.
Roles - lists the roles of the email recipients to which email will be sent when the field changes.
When you select the category in the left pane, the associated fields are displayed in the top right pane. When you select the field in the top right pane, its associated options are displayed in the Option List.
The Oracle OpenScript main window is where you develop the scripts used for functional/regression testing and load/performance testing of your Web site or application. Specific types of scripts you develop using Oracle OpenScript can also be used by Oracle Load Testing or Oracle Test Manager.
Scripts represent a sequence of actions and tests performed on a Web site or application. Scripts are used by Oracle OpenScript for regression testing and Oracle Load Testing for performance (load and scalability) testing.
The Oracle OpenScript main window consists of the menu bar, toolbar, and the scripting workbench in the Eclipse Integrated Development Environment (IDE). The Workbench provides an Eclipse-based scripting platform where you can create and run your automated test scripts. Users can use the Tree View graphical scripting interface for creating and editing scripts through the UI. Users can also switch to the Java Code view programming interface and leverage the integrated Eclipse IDE for creating and editing their scripts programmatically.
The workbench includes a Tester Perspective and a Developer Perspective. The Tester Perspective provides a convenient way to record and edit scripts and view the playback results. The Developer Perspective provides advanced options for developers when creating and editing scripts using the advanced features of OpenScript and the Eclipse development platform.
The OpenScript Test Modules provide application-specific test automation capabilities. Each Test Module is custom built to test a specific application or protocol. OpenScript includes several functional and load testing modules for testing Web-based applications.
Shows the recorded script in two tabs: Tree View and Java Code. The Tree View tab shows the steps and pages and the Initialize, Run, and Finish nodes of each step using a graphical tree view. The Java Code tab shows the underlying Java code used for the script.
The script view is where you perform the majority of script editing actions. The Script view has the following tab views:
The Tree View shows the script navigations and data as nodes in a collapsible tree view. The Tree View corresponds to the Java Code view. Any changes in the Tree View will be automatically updated in the Java Code view.
The Tree View has the following standard nodes:
Initialize - specifies script actions to perform once at the beginning of script playback.
Run - specifies script actions to perform one or more times during script playback depending upon databanks or other custom programming.
Finish - specifies script actions to perform once at the end of script playback.
Use the Record options and right-click shortcut menu to add options to script nodes or modify the properties of script nodes in the Tree View.
The Java Code view shows the script navigations and data as Java programming code. The Java Code view corresponds to the Tree View. Any changes in the Code View will be automatically updated in the Tree View.
The Java Code view has the following standard procedures:
initialize() - corresponds to the Initialize node of the Tree View and executes any custom code added once at the beginning of script playback.
run() - corresponds to the Run node of the Tree View and executes recorded and custom code one or more times during script playback depending upon databanks or other custom programming.
finish() - corresponds to the Finish node of the Tree View and executes any custom code added once at the end of script playback.
Use Ctrl-space to open an Intellisense window listing available procedures.
Figure 2-11 Java Code View Intellisense Window
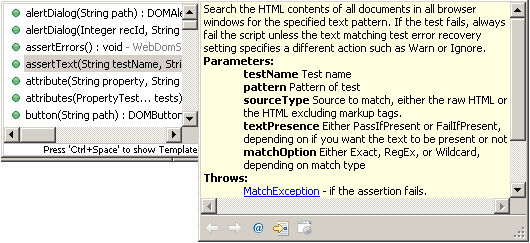
See the API Reference in the OpenScript Platform Reference help for additional programming information.
The Details view shows the content details for URL navigations added to the script.
Figure 2-12 Details View Showing Screenshot Tab View
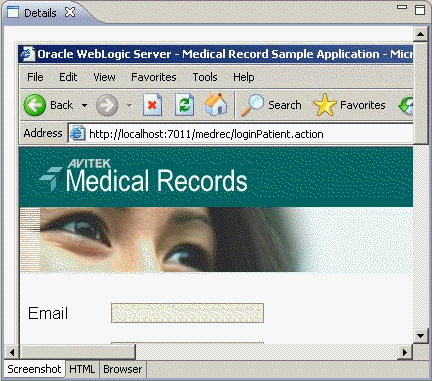
The Details view may have the following tab views depending upon the selected script node and type of script:
ScreenShot - shows a screen capture of the web page.
Browser - shows the Browser rendered page for the script navigation selected in the tree view.
HTML - shows the HTML source for the script navigation selected in the tree view.
Headers - shows the Request Header and Response Header source for the script navigation selected in the tree view.
Comparison - shows the recorded and playback text for the Content, Request Header, or Response Header selected in the Compare list. The Comparison tab appears only after a script is played back and a navigation is selected in the Results View.
Results Report - shows the results report for the script playback. The Results Report tab appears only after a script is played back and a navigation is selected in the Results View.
The Problems view shows any problems in the script code that may produce errors or prevent compiling the script.
The Problems view shows the following information:
# error, # warnings, # infos - shows the number of errors, warning messages, and information messages in the problems view.
Description - shows a description of the errors, warning messages, and information messages.
Resource - shows the name of the resource file where the error, warning, or information message was generated.
Path - shows the script name, workspace, and repository path where the resource file is located.
Location - shows the location/line number where the error, warning, or information message was generated.
The following toolbar button is available in the Problems View:
Configure the filters to be applied to this view - opens a dialog box for configuring the filters to apply to the Problems View.
The Properties view shows the properties for the selected node in the script.
The Properties view shows the following information:
Property - shows the names of the properties for the script node. The properties vary depending upon which type of script node is selected.
Value - shows the value of the script node properties. Property values can be edited in the properties view.
The following toolbar buttons are available in the Properties View:
Show Categories - toggles the property categories.
Show Advanced Properties - toggles the advanced properties.
Restore Default Value - restores any changed property values to the default values.
The Console view shows the playback command output and status information for the script. Script log message also appear in the Console.
See the Process Console View topics in the reference section of the Java development user guide online help for additional information about console toolbar options.
The Results view shows the playback results for the script.
The Results view shows the following information:
Name - shows the test date or navigation name.
Duration - shows the playback time for the page navigations.
Result - shows the playback result: Passed or Failed.
Summary - shows the data values from the Data Bank that are passed to parameters or it shows failure descriptions.
The following toolbar buttons are available in the Result View:
Delete Result - deletes the selected result row.
Delete All Results - deletes all rows from the Results View.
Scroll Lock - toggles scroll lock on and off for the Result View.
Properties - opens the Properties for the selected result.
The Oracle Load Testing main window is where you perform the majority of your load/performance testing activities. Oracle Load Testing uses scripts that you develop using Oracle OpenScript.
The main window consists of the menu bar, toolbar, and the controller tab dialogs.
Figure 2-17 Oracle Load Testing Main Window
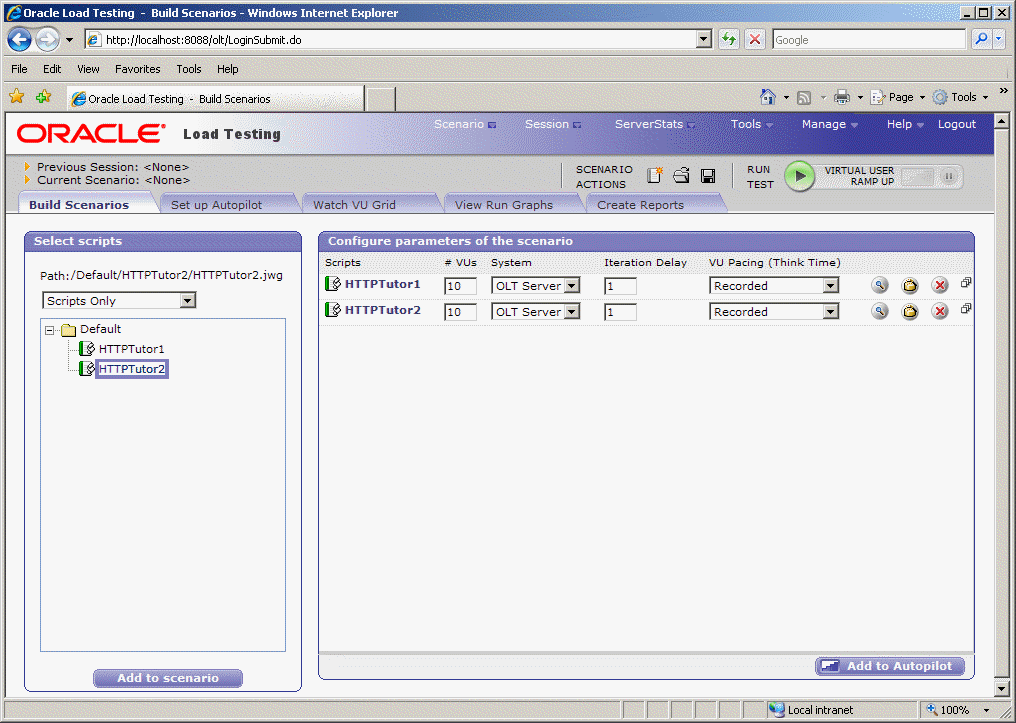
You can open the Oracle Load Testing application from the Start menu.
The Build Scenario tab is where you specify information about the virtual users to include in the load test and the attributes for each set of virtual users.
You can define user profiles that specify which scripts the users playback to emulate real users and how many virtual users to emulate.
The Autopilot tab is where you specify the information needed to control how the scenario starts and runs. The Autopilot controls the starting and stopping of the scenario, the rate at which new virtual users are started, and shows the total number of virtual users and the number of running virtual users.
You specify the session, start and stop times, and the virtual user rampup specifications for the Submitted Scenario Profile. It also shows the list of virtual user profiles submitted in the Oracle Load Testing scenario.
The Autopilot tab is also where you select the ServerStats configuration to apply to the load test scenario. ServerStats configurations define the metrics or metric profiles to use to monitor server-side application, database, system, and Web server statistics during a load test scenario.
The Watch Virtual User Grid tab lists the currently running virtual users and the profile and playback details associated with each.
The View Run Graphs tab lets you define graphs and view the graphs at run-time.
You can also view the Performance Statistics report from the View Run Graphs tab. The Performance Statistics window shows a summary of the performance data for the running virtual users.
The ServerStats component of Oracle Load Testing lets you monitor a variety of server-side application, database, system, and Web server statistics. You can configure ServerStats to display real-time performance statistics for the various hosts and services available from the server such as, percentage of CPU usage, memory usage, Web server statistics, etc.
Figure 2-23 ServerStats Metric Profiles Window
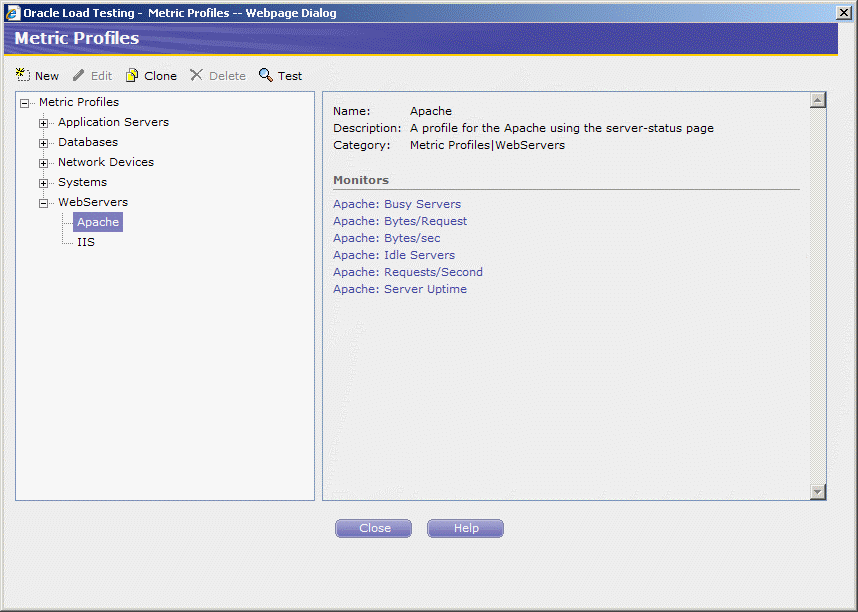
You can monitor specific counters in real time using the visual indicator gauges or using graphs. In addition to performance monitoring, ServerStats let you define scripts that can log warnings or alarms if a server's counter performance goes outside a defined range.
Oracle Test Manager lets you create projects that group together and organize test scripts, requirements that need to be tested, and issues resulting from the tests. Once created, you can indicate the relationships among these items, allowing you to quickly and easily find all information pertaining to a particular test script, requirement, or issue.
The main window consists of the menu bar, toolbar, and the tab views.
The requirements tab lets you work with requirements.
The number of requirements displayed is determined by the number you enter in the Maximum Tree Nodes field in options. You can:
Expand and collapse the tree view by clicking on the plus and minus signs.
View the next or previous group of requirements by clicking the Next or Previous button.
Hold the mouse over a node to view a count of its child nodes.
Move requirements by selecting a requirement and using the move buttons.
Search requirements by clicking the Find button.
Group requirements by clicking Group.
Filter requirements by clicking Filter.
Toggle between the tree view and grid view by clicking the Tree View and Grid View buttons.
The color of the icon in front of the requirement indicates its priority. The default colors are as follows and can be changed by changing the order of the Requirement Priorities in the Administrator.
Red, high priority
Yellow, medium priority
Green, low priority
The right pane lists the selected requirement's details. In the upper right corner, associated tests and issues are listed as well as attachments and links. You can:
Click Edit this requirement to open the Edit Requirement dialog box.
Click Print to print the right pane.
Click e-Mail to e-mail the requirement. The title and description are automatically copied to the e-mail.
Click on an associated test or issue to view its details.
Click on an attachment to open it in the appropriate application.
Click on a link to view the URL in a separate browser window.
Select Add/Edit to add or edit attachments, links, or associated items.
The tests tab lets you work with tests.
The number of tests displayed is determined by the Maximum Tree Nodes setting in options. You can:
Expand and collapse the tree view using the plus and minus signs.
View the next or previous group of tests by clicking the Next or Previous button.
Hold the mouse over a node to view a count of its child nodes.
Move tests by selecting the test and using the Move buttons.
Search tests by clicking the Find button.
Group tests by clicking the Group button.
Filter tests by clicking the Filter button.
Schedule when to run tests by clicking the Schedule button.
Toggle between the tree view and grid view by clicking the Tree View and Grid View buttons.
The icon in front of the test indicates the type of test as follows:
Manual test - blue with a pencil.
Test folder - blue with a spiral.
Oracle OpenScript - blue with a pencil.
Test group - blue with a plus sign.
3rd Party test - blue with two stars
The color of the icon in front of the test indicates the last result from running the test, as follows:
Green, passed
Red, failed
Yellow, warning
Blue, not run
Silver, currently running
The right pane lists the selected test's details. Test steps and run history are displayed. You can:
Click Edit this test to open the Edit Test dialog box.
Click Print to print the right pane.
Click e-Mail to e-mail the test. The title and description are automatically copied to the e-mail.
Click Run this test to start the Run Manual Test wizard or run an Oracle OpenScript test.
Click Delete Results to display the Delete Results dialog box for deleting results from particular test runs.
Click the date in the Run History section to display result details for a particular run.
In the upper right corner or the right pane, associated requirements and issues are listed as well as attachments and links. You can:
Click on an associated requirement or issue to view its details.
Click on an attachment to open it in the appropriate application.
Click on a link to view the URL in a separate browser window.
Select Add/Edit to add or edit attachments, links, or associated items.
The issues tab lets you work with issues.
The number of issues displayed is determined by the Maximum Tree Nodes setting in options. You can:
View the next or previous group of issues by clicking the Next or Previous button.
Group issues by clicking the Group button.
Filter issues by clicking the Filter button.
Hold the mouse over a node to view a count of its child nodes.
Search issues by clicking the Find button.
Toggle between the tree view and grid view by clicking the Tree View and Grid View buttons.
Display a particular issue by entering the issue number in the Goto field and clicking the Goto button.
The color of the icon in front of the issue indicates its priority. The default colors are as follows and can be changed by changing the order of the Issue Priorities in Oracle Test Manager Administrator:
Red, high priority
Yellow, medium priority
Green, low priority
The number inside the icon corresponds to the status number.
The right pane lists information about the selected issue including the issue's details, solution, priority, and status. You can:
Click Edit this issue to open the Edit Issue dialog box.
Click Print to print the right pane.
Click e-Mail to e-mail the issue. The title and description are automatically copied to the e-mail.
In the upper right corner of the right pane, associated requirements, tests, and issues are listed as well as attachments and links. You can:
Click on an associated test, requirement, or issue to view its details.
Click on an attachment to open it in the appropriate application.
Click on a link to view the URL in a separate browser window.
Select Add/Edit to add or edit attachments or links.
The Reports tab lets you work with both standard and custom reports.
Oracle Test Manager comes with a standard set of reports that can be viewed as either a graphic or as data. In addition, you can create custom reports to display only the data that you are interested in. You can:
View a standard or custom report by selecting it from the left tree.
Add a custom report by clicking Add.
Edit a custom report by clicking Edit.
Delete a custom report by clicking Delete.
Clone an existing report to create a copy of it that you can then edit by clicking Clone.
Save custom reports by clicking Save.
Email reports by clicking Email.
Print reports by clicking Print.
Filter the fields in the report to display only the data in which you are interested.
Export reports to jpg, and xls formats.
The Dashboard tab lets you view an overview of reports.
One Dashboard report is available for requirements, tests, and issues. You can customize which reports are displayed for each and then save the view. In addition, you can select the number of columns to use for the display.
You can:
Add reports to the view by clicking Add.
Remove the selected dashboard report by clicking Delete.
Save the customized view by clicking Save.
Print dashboard reports by clicking Print.
Toggle the display of the report tree by clicking Toggle.
Each report has the following toolbar with the following options, described from left to right.
Move Left - moves the report one space to the left.
Move Up - moves the report up one space.
Move Down - moves the report down one space.
Move Right - moves the report one space to the right.
Minimize - minimizes the report.
Maximize - displays the report in a separate window. From there you can toggle between report and data views, and export the report.
Delete - removes the report from the display.