 Pivot Grid Wizard Overview
This chapter provides an overview of the Pivot Grid wizard and discusses how to:
Create a Pivot Grid model using the Pivot Grid wizard.
Specify data model options.
Update a Pivot Grid model using the Pivot Grid wizard.
Pivot Grid Wizard Overview
You use the Pivot Grid wizard to create and maintain Pivot Grid models. The wizard consists of five steps that lead you through the process of defining the core of the grid (data, values, and axes) and initial pivot display (chart type and viewing options). Users with the appropriate security also use the Pivot Grid wizard to update existing models.
This diagram illustrates the processes of creating and updating a Pivot Grid model:
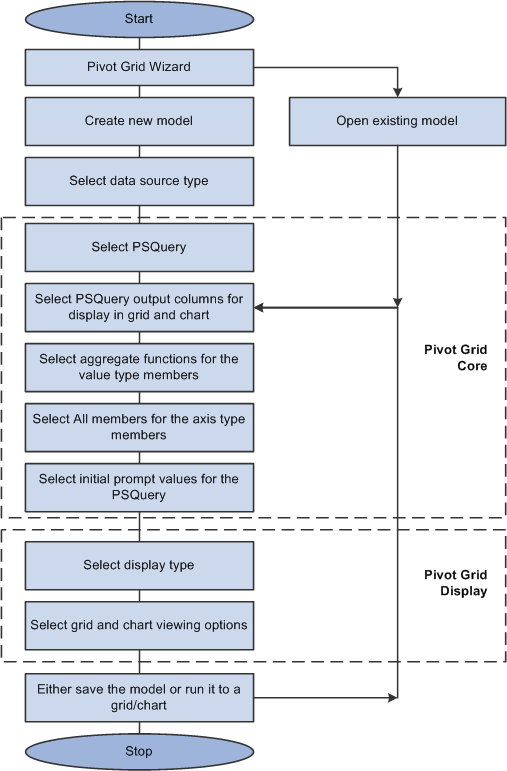
Flowchart for creating and updating a Pivot Grid model
Creating a Pivot Grid Model Using the Pivot Grid WizardThis section discusses how to:
Specify Pivot Grid properties.
Select a data source.
Specify data model values.
Specify data model options.
View Pivot Grid displays.
 Pages Used to Create a Pivot Grid Model Using the Pivot Grid Wizard
|
Page Name |
Definition Name |
Navigation |
Usage |
|
Specify Pivot Grid Properties |
PTPG_WIZ_INFO |
Reporting Tools, Pivot Grid, Pivot Grid Wizard |
Use this page to identify and categorize the data model for the pivot grid. |
|
Select Data Source |
PTPG_WIZ_DATASRC |
From the Specify Pivot Grid Properties page, click the Next button. |
Use this page to select the PSQuery and output columns from the PSQuery for the data model. |
|
Specify Data Model Values |
PTPG_WIZ_MODEL |
From the Select Data Source page, click the Next button. |
Use this page to define the column type and aggregate functions for the selected data model. |
|
Specify Data Model Options |
PTPG_WIZ_OPT |
From the Specify Data Model Values page, click the Next button. |
Use this page to define the initial layout of the grid and the chart. |
|
Pivot Grid Display |
PTPG_WIZ_DISP |
From the Specify Data Model Options page, click the Next button. |
Use this page to review the Pivot Grid model based on the display option and layout selected. |
Specifying Pivot Grid Properties
Access the Specify Pivot Grid Properties page by selecting Reporting Tools, Pivot Grid, Pivot Grid Wizard.
This example shows the Specify Pivot Grid Properties page:
|
Pivot Grid Title |
Enter a title for the pivot grid. This field is required. |
|
Pivot Grid Type |
Select whether the Pivot Grid model is Private or Public.
|
|
Valid Model |
Select the check box if the model is valid. Note. Only valid models are available from the Pivot Grid Viewer. |
|
Next |
Note. The Next button is available after you enter the title of the pivot grid in the Pivot Grid Title field and move to any other field. Click to advance the wizard to the next page. |
Selecting a Data Source
Access the Select Data Source page by selecting the Next button on the Specify Pivot Grid Properties page.
This example shows the Select Data Source page:
|
Data Source Type |
Select a data source type. Note. In PeopleTools 8.52, Pivot Grid supports only PSQuery. |
|
Query Name |
Click the search icon to select a query from the list of existing queries. Note. Only one query can be associated with one Pivot Grid model as a data source. |
|
Select Columns |
Select the output columns to be plotted on the Pivot Grid model.
Note. The Select Column section is available after you select an existing
query in the Query Name field using the search
icon or after you enter a valid query name and tab out of the Query
Name field. |
|
Next |
Click to advance the wizard to the next page. Note. The Next button is available after you select at least two columns in the Select Columns section. |
Specifying Data Model Values
Access the Specify Data Model Values page by selecting the Next button on the Select Data Source page.
This example shows the Specify Data Model Values page:
|
Column Type |
Define the axis and value members for a column. Note. At least one Axis and one Value member is required. |
|
Total |
Select which Axis members have the Total (All) attribute enabled. Note. This column is available only for the data source column with column type Axis. |
|
Aggregate Functions |
Define the aggregate functions for the Value type members. Available options are Avg, Count, Max, Min, and Sum.
Note. This column is only available for the data source column with
column type Value.
|
|
Select Query Prompt Values |
Enter the default values for the PSQuery runtime prompts. Note. This section is only available when the selected query has prompts attached. |
|
Next |
Click this button to advance the wizard to the next page. |
Specifying Data Model Options
Access the Specify Data Model Options page by selecting the Next button on the Specify Data Model Values page.
This example shows the Specify Data Model Options page:
This page has three main sections: Display Options, Grid Options, and Chart Options. Each section can be expanded or collapsed.
Expand to display the view options.
|
Display |
Define Pivot Grid view options for the grid and the chart. Available options are:
|
|
Specify Axis Information |
Select the initial grid and chart layout. Note that:
Note. In PeopleTools 8.52, the number of filters is limited to four if the display option is Chart Only. |
Grid Options
Use the Grid Options section to define Pivot Grid view options for the grid and the chart:
|
Collapsible Data Area |
Select to allow viewers to collapse the data area. |
|
Expanded State |
Select to have the initial view expanded. |
|
No Drag and Drop |
Select if you do not want users to have the ability to drag and drop filters, rows, and column axes. |
Chart Options
Expand the Chart Options section to enter additional chart options:
|
Chart Title |
Enter a title for your chart. By default, the Pivot Grid model name is used. |
|
Chart Type |
All PeopleSoft chart types are supported. |
|
X-Axis Label |
Enter a label for the X axis. By default, the field name for the X axis is used. |
|
X-Axis Label Angle |
Enter an angle for the axis. If this field is left blank, the default angle of the vertical text is 90 degrees. |
|
Y-Axis Label |
Enter a label for the Y axis. By default, the field name for the Y axis is used. |
|
Y-Axis Label Angle |
Enter an angle for the axis. If this field is left blank, the default angle is 45 degrees. |
|
Advanced Options |
Define display options for the chart, including rotation angle, chart legend, and height and width of the chart. |
|
Next |
Click to advance the wizard to the next page. |
Viewing Pivot Grid Displays
Access the Pivot Grid Display page by selecting the Next button on the Specify Data Model Options page.
This example shows the Pivot Grid Display page:
Use the Pivot Grid Display page to preview of the Pivot Grid model based on the display option and layout that you selected. Optionally, you can modify the Pivot Grid model to finalize the design and then click the Save button to save it. Pivot Grid model metadata is saved to the database.
Note. When working with the Pivot Grid wizard, you can modify your previous selections at any step by clicking the step number icons. Changes to your selections could change the Pivot Grid model.
Specifying Data Model Options
The way you define the data model determines the actions that are available in the pivot grid, as well as the initial view. This section provides some examples of data sources designed to:
Use a filter.
Use multiple filters.
Use a series.
Use an overlay.
Using a Filter
In this example, all the axis columns have Total enabled.
On the Data Source page, Month is defined as a filter:
This example shows the view of a Pivot Grid model when the display option is Grid and Chart:
Note that:
You can change the grid layout at runtime by dragging members onto a different axis.
The chart layout also changes based on the grid layout to preserve synchronization between the grid and the chart.
Click the Chart Options button to change the chart type and the Y axis of the chart.
The Pivot Grid displays detailed data based on the region on which a drilldown is performed. For the chart, the same data appears for the selected Value column. You can select the chart type and change the Y axis by selecting a different Value column to be plotted.
This example shows a Pivot Grid model when the display option is Grid and Chart and the user drilled down on a region:
Using Multiple Filters
In this example, Product and Month are defined as filters:
These same filter values also drive the chart. The X axis of the chart is preselected based on the grid layout. You can select the chart type and the Y axis.
Using a Series
Series value is automatically determined for the chart when the display option is Grid and Chart. The automation is dependant on the grid layout; if any dimension (axis type) is selected on the column, then it is automatically selected as a series for the chart.
In this example, all the axis columns have All (Total) enabled. On the Data Source page, Month is defined as column axis and used as a series:
This example shows the chart with detailed data based on the Month field:
Using an Overlay
If the display option is Chart Only, selecting a column as an overlay field results in plotting multiple charts based on the Y axis and the overlay field. In this example, Unit Cost is used as an overlay field.
Note. In PeopleTools 8.52, chart overlay is not available when the display option is Grid and Chart.
The chart is plotted with Region as the X axis and Unit Sales as the Y axis. The second chart is plotted with Region as the X axis and Unit Cost as the Y axis.
Users can change the overlay field using fields in the Specify Data Model Options page, Chart Options section.
Updating a Pivot Grid Model Using the Pivot Grid WizardThis section discusses how to update a Pivot Grid model using the Pivot Grid wizard.
Steps Used to Update a Pivot Grid Model Using the Pivot Grid Wizard
To update a Pivot Grid model using the Pivot Grid wizard:
Select Reporting Tools, Pivot Grid, Pivot Grid Wizard.
Search for and select an existing Pivot Grid model to update.
Modify the Pivot Grid model.
Preview the changes on the last page of the wizard.
Save the Pivot Grid model.
The Pivot Grid model metadata is saved to the database.