Cross-Product Integration
This chapter details the integration between Oracle Inventory Optimization and Oracle Demand Planning.
This chapter covers the following topics:
- Integration with Demand Planning
- Oracle Inventory Optimization and Intermittent Demand Attributes from Demand Planning
Integration with Demand Planning
Oracle Inventory Optimization requires inputs such as demand forecast and demand variability from Oracle Demand Planning. This chapter also briefs how the inventory planning engine spreads forecast that it receives from Oracle Demand Planning.
Uncertainty in demand influences inventory optimization decisions. For example, you may increase the level of your safety stock to satisfy demand spikes during a specific time period. You may want to consider the distribution of demand over a time period or an order replenishment lead-time to drive safety stock calculations.
Oracle Inventory Optimization uses the following inputs from Oracle Demand Planning to plan optimal levels of inventory:
-
Demand forecast
-
Demand variability
Forecast Accuracy Measures
An estimate of demand variability indicates the forecast accuracy, also referred to as the forecast error. Oracle Demand Planning calculates the following to estimate the standard deviation of forecast error:
-
Mean absolute deviation
-
Mean absolute percentage error
Based on the demand variability information from Oracle Demand Planning, Oracle Inventory Optimization estimates the safety stock required to avoid stock out. Oracle Advanced Supply Chain Planning uses the demand variability information to suggest the optimal quantity that you need to order and the time when you need to place the order. For more information on mean absolute deviation and mean absolute percentage error, see The Organizations Tabbed Region.
You can instruct Inventory Optimization to use the Negative Binomial distribution as the forecast error distribution for items with high variability intermittent demands when calculating safety stock levels. To do this, use the profile option MSR: Variance to Mean Threshold for Use of Negative Binomial Distribution. If a value is specified for this profile option, then Inventory Optimization uses either the Negative Binomial Distribution or the Poisson Distribution for demand variability modeling when the item attribute Intermittent Flag is set to “Yes”. The selection of the distribution is based on comparing the ratio of (Variance / Mean) of the demand with the profile option value
If a value is specified for this profile option, then Inventory Optimization uses either the Negative Binomial Distribution or the Poisson Distribution for demand variability modeling when the item attribute Intermittent Flag is set to Yes. The selection of the distribution is based on comparing the ratio of (Variance / Mean) of the demand with the profile option value. If the Variance/Mean ratio is greater than the profile option value, then IO uses Negative Binomial Distribution. If the variance/Mean ratio is less than or equal to the profile option value, then IO uses Poisson Distribution.
The default value for this profile option is NULL. In this case, IO uses the Poisson Distribution when the item attribute Intermittent Flag is set to Yes.
Business Process Flow
The following illustration represents flow of information between Oracle Demand Planning and Oracle Inventory Optimization.
Business Process Flow
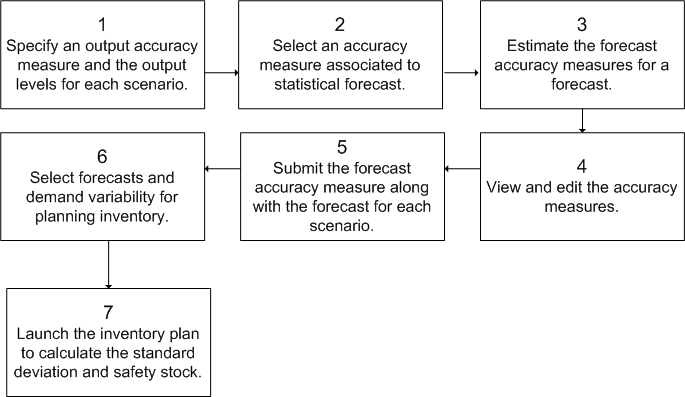
You need to perform steps 1 through 5 using Oracle Demand Planning. Perform steps 6 and 7 using Oracle Inventory Optimization. The following steps summarize the business process flow depicted in the illustration:
-
Step 1: In Oracle Demand Planning, you can use the Demand Planning System Administrator responsibility to specify an output accuracy measure (mean absolute deviation or mean absolute percentage error) for each scenario. In addition, you can specify the output levels for each scenario based on your inventory planning requirements.
-
Step 2: You can use the Demand Planning System Administrator responsibility, the Demand Planning Manager responsibility, or the Demand Planners responsibility to select an accuracy measure (mean absolute deviation or mean absolute percentage error) that is associated to statistical forecast. Oracle Demand Planning calculates the specified accuracy measure when it generates statistical forecast.
-
Step 3: You can select a forecast and the levels at which Oracle Demand Planning needs to calculate the forecast accuracy measure. You can also select a comparison measure to calculate the forecast accuracy measure.
-
Step 4: You can view the properties of accuracy methods and scenarios. Oracle Demand Planning compares the demand forecast with historical data to calculate forecast accuracy. However, as the demand forecast is futuristic, it is unlikely to have any common time period to compare against with the historic data. Therefore, you can modify the forecast accuracy measures in Oracle Demand Planning.
-
Step 5: Using the Demand Planning Manager and Demand Planner responsibilities, you can submit the forecast accuracy measure and the forecast for each scenario at specific output levels. When you submit the forecast accuracy measure, the Oracle Demand Planning Express pushes the information to Oracle Demand Planning Server. Oracle Demand Planning Server shares this information with Oracle Inventory Optimization. The forecast accuracy measure is identified by a scenario name, a forecast name, and a measure type (mean absolute deviation or mean absolute percentage error). Oracle Inventory Optimization requires forecast accuracy measures at the following levels:
-
Item or product in the Product dimension
-
Organization in the Ship From Location dimension
-
Day, week, or manufacturing in the Time dimension
-
Highest level such as All Geography and All Sales Channel for all other dimensions
-
-
Step 6: In Oracle Inventory Optimization, you can use the Inventory Planners responsibility to select forecasts and demand variability for planning inventory. You can select the demand variability as a plan option in Oracle Inventory Planning. Alternatively, if you want to run simulations of an inventory plan using different percentage demand variability values for different scenario sets, you can specify a default demand variability percentage at the scenario set level. The following are characteristics of a scenario set:
-
You can deploy only one type of demand variability (accuracy metric from Oracle Demand Planning, user-defined probability, or user-defined mean absolute % error) in a scenario set.
-
The list of values for the type of demand variability depends on the forecast you select. For example, Accuracy Metric appears as a type of demand variability only when you select a scenario from Oracle Demand Planning.
-
Oracle Inventory Optimization uses the forecast accuracy information that Oracle Demand Planning provides to calculate the safety stock.
-
If you select a specific type of demand variability for a scenario set, the scenario sets having the same scenario set number acquire the type of demand variability. For example, if you select Accuracy Metric as the type of demand variability for a scenario set, it applies to all scenario sets that have the same scenario set number. In addition, the Mean % Error and Probability fields for the scenario sets become disabled.
-
-
Step 7: You can launch the inventory plan in Oracle Inventory Optimization to determine the standard deviation and the safety stock.
Forecast Spreading
If Oracle Inventory Optimization receives a period level forecast from Oracle Demand Planning, the inventory planning engine spreads the forecast to weekly forecasts of equal sizes. Oracle Inventory Optimization spreads forecasts to prevent safety stock spikes.
Oracle Inventory Optimization and Intermittent Demand Attributes from Demand Planning
Inventory Optimization considers the demand pattern (regular or intermittent) in its safety stock calculation. Currently you can specify an item's demand pattern as intermittent using an attribute called “Intermittent Demand” in the Item Attributes Mass Maintenance (IMM) window. For items that this attribute is not specified by users, IO analyzes and determines their demand patterns as part of the safety stock calculation.
IO now receives the value of the Intermittent Demand attribute (Intermittency Flag) from Oracle Demand Management. This value is used in the safety stock calculation if there is no user-specified value in IMM.
In addition, the following item attributes related to an item demand pattern are now displayed in the Items window in the Planner's Workbench (PWB):
-
Intermittent Demand
-
Mean Interarrival Time
-
Demand Variance
-
Average Daily Demand
Note: The Intermittent Demand column is displayed as blank if the demand schedule and Intermittent Demand are at the Item/Zone level.
Understanding Intermittent Demand Attributes from Demand Planning
Demand Planning generates and populates the following fields in BIEO_LOCAL_FCST table and pushes these data to MSD_DP_SCN_ENTRIES_DENORM table (Demand Table):
-
Intermittent Demand
-
Mean Interarrival Time
The IO engine uses the Demantra generated values of Intermittent Demand and Mean Interarrival Time if the user-defined value of Intermittent Demand in the user-defined IMM Simulation Set is set to NULL or Auto. If the user-defined values of intermittent demand are set to Yes or No, they override the system generated values and the IO engine uses the user-defined values.
IO also calculates the Demand Variance field and the Average Daily Demand field, which are used to compare against the user-specified value of for Profile Option MSR: Variance to Mean Threshold for use of Negative Binomial Distribution.
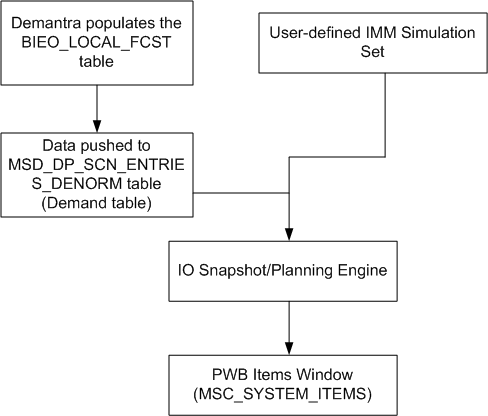
Receiving the Intermittency Flag from Demand Planning Data Flow
The Planners Workbench (PWB) displays the following item attributes related to an item demand pattern in the Items window:
-
Intermittent Demand
Note: The Intermittent Demand column is blank if the demand schedule and intermittent demand are at the Item/Zone level.
-
Mean Interarrive
Note: The Mean Inter Arrival attribute in IMM is renamed to Mean Interarrival Time for both Forms and ADF formats
-
Demand Variance
-
Average Daily Demand
This Intermittent Demand received from Oracle Demand Management is applied only to the item org level. The Intermittent Demand column is displayed as blank in the Items window if the demand schedule and Intermittent Demand are at the Item/Zone level. The Intermittent Demand flag for forecasts at the item zone level is received from Oracle Demand Management and used in IO but not displayed.
Note: The Intermittent Demand flag for forecasts at the item zone level is received from Oracle Demand Management and used in IO but not displayed.
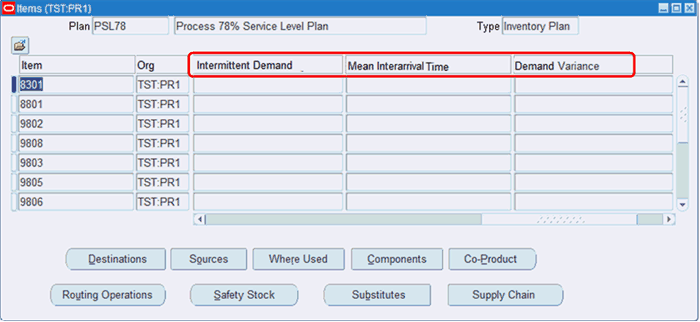
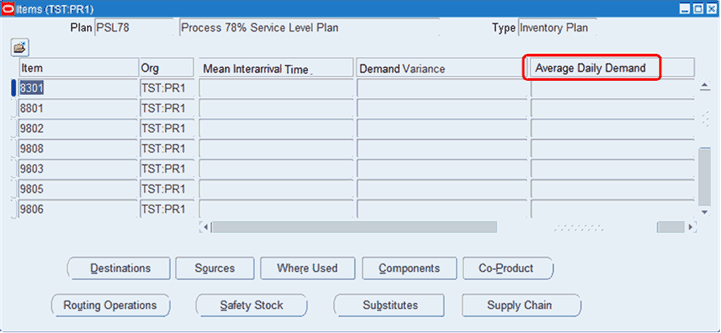
Receiving the Intermittency Flag from Demand Planning Process
The process of receiving the Intermittency Flag from Demantra follows the process outlined below:
-
IO receives the value of the Intermittent Demand Attribute (Intermittency Flag) from Oracle Demantra.
-
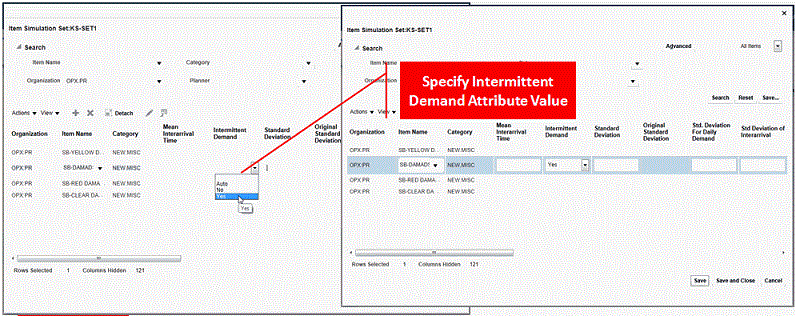
You specify the Intermittent demand Attribute Values in the Item Attributes Mass Maintenance (IMM) window. Valid values are:
-
Yes: IO uses the value specified in IMM
-
No: IO uses the value specified in IMM
-
Auto: IO uses the value received from Demantra (Yes or No)
-
NULL (blank): IO uses the value received from Demantra (Yes or No)
-
-
Verify the Intermittent Demand values used by the plan in the PWB Items page.
-
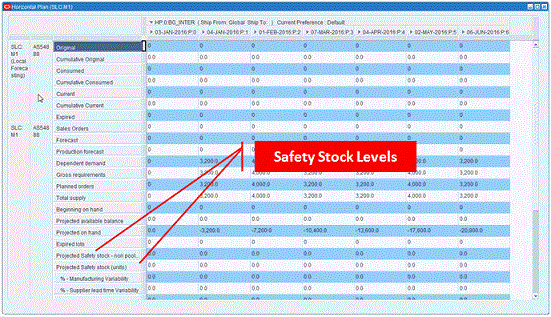
Analyze the plan output and verify the effects of Intermittent Demand attribute values on your safety stock levels.
How to Receive the Intermittency Flag from Demand Planning
To receive the Intermittency Flag from Demand Management, follow the procedure below:
-
From the Item Attributes Mass Maintenance (IMM) window, specify Intermittent Demand attribute values.
-
Verify the Intermittent Demand values used by the plan in the Planners Workbench (PWB) Items page.
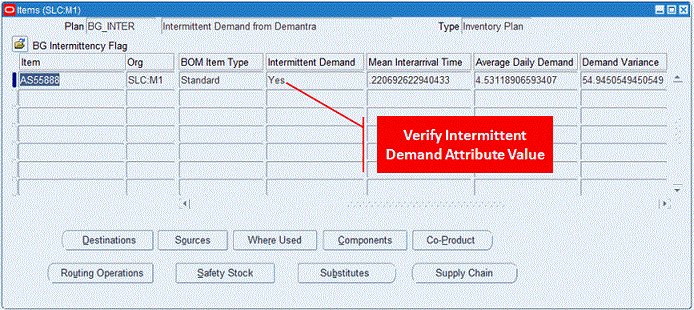
The Intermittent Demand attribute value in the plan Items window is the value specified in IMM when the value is Yes or No If there is no value specified in IMM (NULL) or the specified value is “Auto”, the value displayed in the Items page is the value received from Oracle Demand Management.
-
From your Horizontal Plan, analyze the plan output to verify the effects of Intermittent Demand attribute values on the safety stock levels.
For more information on Intermittent Demand, refer to the Oracle Demantra Demand Management User's Guide.