Scenarios, Events, and Key Performance Indicators
This chapter covers the following topics:
Scenarios and Events Overview
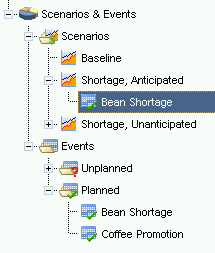
Scenarios
To make effective strategic decisions, you must be able to model "what-if" scenarios in your supply chain network and examine alternative strategies to resolve supply chain problems. Strategic Network Optimization enables you to define and organize different scenarios and events, add events to scenarios, and compare the results of related solves with key performance indicators. For example, if you want to see the effects of increases or decreases in demand or capacity, or different sourcing strategies, you can set up, run, and examine scenarios and events.
You can use scenarios and events in batch mode. All scenario and event functionality available in the user interface is also accessible in batch mode by using various scenario and event commands.
Playing and analyzing separate scenarios can be difficult for users to visualize because data is stored in several models or import files. Scenarios and events enable you to keep track of all model changes and results within a single model. You can define and save scenarios that can be used repeatedly in your model. For example, you can define a scenario to see the effect of a 10 percent increase in demand. You can create this scenario once and run it several times without having to manually specify the data changes each time that the scenario is played.
You can run any of the scenarios that have been defined. Once the scenario has run, the changes are applied to either the current model or the last saved model. This depends on whether or not you have checked the Run from Baseline checkbox in the Scenario window. The changes are applied using start scripts, and the specified find and replace criteria defined in the events. The import files are loaded, the view options are applied, associated find and replace commands are executed, and end scripts are applied.
Note: When you run a scenario from the baseline, changes made to the model since it was opened are discarded.
When a scenario runs, the following steps are taken:
-
Pre-scripts are applied to the scenario. If more than one pre-script exists, they are applied from the top down.
-
All planned events are applied.
-
Find and Replace templates are applied.
-
Import files are loaded. If more than one import file exists, they are loaded from the top down.
-
-
The scenario is solved.
-
All unplanned events are applied.
-
Find and Replace templates are applied.
-
Import files are loaded. If more than one import file exists, they are loaded from the top down.
-
Periods before the period in which the unplanned event occurs are fixed.
-
-
The scenario is solved.
-
Post-scripts are applied to the scenario. If more than one post-script exists, they are applied from the top down.
-
Reports are displayed.
-
Views are applied. The view is specified when you set up the scenario.
Events
Events are individual occurrences which impact the supply chain. Events are created and then added to scenarios. They specify the find and replace functions which are performed within the model. Each scenario should have at least one event assigned to it. If you run a scenario with no events in it, the model baseline solves. Several events can be added to the same scenario.
There are two kinds of events:
-
Unplanned
-
Planned
Unplanned events are complete surprises; you have no warning that the event will occur and slack in the supply chain — usually in the form of inventory — is no longer available. A sudden change such as a missed supply can have an immediate impact on a company's operations. Unplanned events allows you to incorporate the concept of surprise into your model's solution. Examples of unplanned events which can massively interrupt supply chain operations include natural disasters such as hurricanes and floods.
Planned events are not surprises and there is at least some react time involved. With this advance warning, there is at least some time to make other supply arrangements and activate contingency plans. Examples of planned events include seasonal supply chain interruptions, anticipated shortages, and increases in demand caused by promotions.
Working with Scenarios and Events
Creating an Event
Before creating any scenarios, you should first create and define events. After deciding if the event is planned or unplanned, follow these steps in the Scenarios and Events area of the Model Workspace:
-
In Events, right-click Unplanned or Planned and choose New Event.
-
In the Event Definition tab, enter a Name and Description for the event.
-
In the Model Changes tab, click the Options button to add import files to the event.
-
In the Options window, click the Add button.
-
Browse to the .imp or .imp.gz file, and click the Open button.
-
In the Model Changes tab of the Event window, click the New button.
-
In the Select Object Type window select the node or arc type that you want to change and click OK.
-
In the Find and Replace window, specify the attributes that you want to find and replace and click OK.
By default, the Run from Baseline checkbox is checked and the .sym model file is reloaded from disk and the scenario is run. If Run from Baseline is not checked, changes are applied to the current model.
-
In the Event window, click OK.
Creating a Scenario
A scenario is a set of actions that are associated with a model. These actions can include any, but not necessarily all, of the following:
-
Applying pre-scripts to a scenario
-
Running events to find and replace data in nodes or arcs by an absolute or relative value
-
Importing data using standard .imp or .imp.gz files
-
Associating user-defined views with a scenario
-
Applying post-scripts to a scenario
-
Displaying scenario report data
To create a scenario, follow these steps in the Scenarios and Events area of the Model Workspace:
-
Right-click Scenarios and choose New Scenario.
-
In the Scenario tab, complete the Name and Description fields.
-
In the Series Selection area, specify the demand and safety stock series for the scenario.
For the demand series, you can select Baseline, Demand 1, or Demand 2. Baseline refers to the Min and Max fields in demand nodes. Demand 1 and Demand 2 refer to the Demand 1 and Demand 2 fields which contain demand values specified by the user.
For the safety stock series, you can select Baseline, Safety Stock 1, or Safety Stock 2. Baseline refers to the Safety fields in Storage, StorageCover and StorageCoverLocal nodes. Safety Stock 1 and Safety Stock 2 refer to the Safety Stock 1 and Safety Stock 2 fields which contain safety stock values specified by the user.
-
Uncheck or check the Run from Baseline checkbox.
-
Click the Options button to add pre-scripts or post-scripts.
-
In the Options window, click the Pre-Scripts tab or the Post-Scripts tab and click the Add button.
-
In the Add Script File window , select the pre-script or post-script that you want to apply to the scenario and click the Open button.
You can add multiple pre-scripts and post-scripts to the same scenario. The system applies the scripts in the order in which you add them to the scenario. When the system plays a scenario, it applies the pre-scripts from the top down.
-
In the Add Script File window, click OK.
-
In the Events tab, click the Add button. You can also add events to a scenario using drag and drop in the Model Workspace.
-
In the Add Events To Scenario window, select an event.
-
Use the From and To drop-down lists to specify when the event occurs.
-
The Find and Replace actions are only applied to this timeframe
-
Each event you add can apply to only one timeframe
-
-
In the Reports tab, click the Add button.
-
In the Add Reports To Scenario window, select a report and click OK.
-
In the Views tab, select a view to display after the solve.
The system saves the scenario criteria.
Renaming, Duplicating, and Deleting Scenarios and Events
You can use right-click options in the Model Workspace area to rename, duplicate and delete a scenario or an event.
To rename a scenario, right-click the scenario and choose Rename.
To duplicate a scenario, right-click the scenario and choose Duplicate. The duplicated scenario has all the same attributes and associations as the original. However, a duplicated scenario is not updated when changes are made to the original. In certain instances, duplicating a scenario and then making any necessary changes might be more efficient than going through the whole process of creating a new scenario.
To delete a scenario, right-click the event and choose Delete.
To rename an event, right-click the event and choose Rename.
To duplicate an event, right-click the event and choose Duplicate. The duplicated event has all the same attributes and associations as the original. However, a duplicated event is not updated when changes are made to the original. In certain instances, duplicating an event and then making any necessary changes might be more efficient than going through the whole process of creating a new event.
To delete a scenario, right-click the scenario and choose Delete.
Editing Scenarios and Events
To edit a scenario or an event, right-click the scenario or event and select Properties.
Removing Events from a Scenario
To remove an event from a scenario, right-click the event and select Remove event from scenario.
Running a Scenario
To run a scenario, right-click the scenario and select Run.
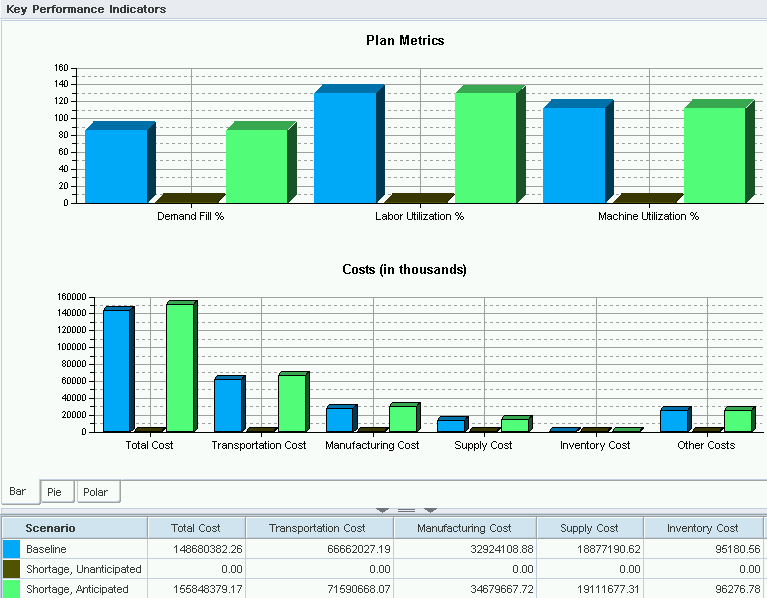
Key Performance Overview
Types of Key Performance Indicators
Key performance indicators facilitate detailed scenario comparisons and provide graphical representation of various metrics in a model. Key performance indicators can show you which scenario is most efficient at filling demand, minimizing inventory costs, or providing the highest percentage of machine utilization. Costs are categorized based on the types of costs in the nodes and arcs and are summed across the whole planning horizon, not by period. Key performance indicators are only visible in Key Performance Indicators view. To get to this view from either Flow view or Map view, click the Kpi View button, seen here below:
![]()
The main user interface switches from Flow view or Map view to Key Performance Indicators View, seen here below:
Types of Key Performance Indicators
Strategic Network Optimization has nine different Key Performance Indicators. They are outlined in the table below:
| Key Performance Indicator | Description |
|---|---|
| Total Cost | The sum of all costs in the model. |
| Transportation Cost | The sum of all costs for any node or arc in the model where Category is set to Transportation. |
| Production Cost | The sum of all costs for any node or arc in the model where Category is set to Manufacturing. |
| Supply Cost | The sum of all costs for any node or arc in the model where Category is set to Supply. |
| Inventory Cost | The sum of all costs for any node or arc in the model where Category is set to Inventory. |
| Other Cost | The sum of all costs for any node or arc in the model where Category is null. |
| Labor Utilization % | Labor utilization expressed as a percentage. |
| Machine Utilization % | Machine utilization expressed as a percentage. |
| Demand Fill Rate % | Demand Fill Rate expressed as a percentage. |
View Options for Key Performance Overview
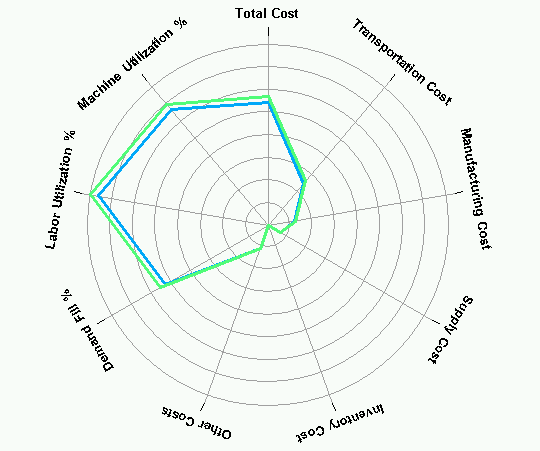
By default, Key Performance Indicator data is displayed in bar chart format. However, the data can also be displayed in pie chart format or polar format by clicking the Pie or Polar tabs. A polar chart displays points in a graph based on data in the scenario. An example of a polar chart can be seen here below:
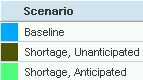
You can also change the color of the data displayed in the key performance indicators by clicking on the color square next to the scenario name, as seen here below:
Selecting Key Performance Indicators
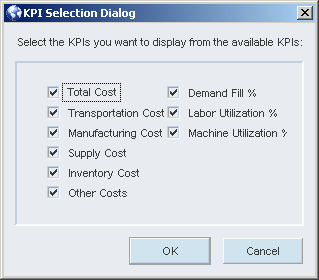
By default, each scenario defined in the Model Workspace appears in the Key Performance Indicators view. You can choose which scenarios are displayed by right-clicking Scenarios in the Model Workspace and choosing KPI Selection. Use the KPI Selection Dialog to select or unselect the key performance indicators you want to show or not show, as seen here below:
Including or Excluding Penalty Costs
You can choose to include or exclude penalty costs in the key performance indicators. Penalty costs are greater than real costs and are calculated by taking all costs and subtracting the real costs. They include such costs as the penalty for going over maximum or under minimum and for stocking out. If you choose to exclude penalty costs, only real costs are shown in the key performance indicators. To include or exclude penalty costs in the key performance indicators, right-click Scenarios in the Model Workspace and choose Exclude Penalty Costs or Include Penalty Costs.