Oracle Enterprise Asset Management Command Center
This chapter covers the following topics:
Enterprise Asset Management Command Center User Interface
Overview
The Enterprise Asset Management Command Center enables increased asset reliability while reducing operational costs, and improves the visibility of key focus areas that enable Enterprise Asset Management supervisors to take quick actions in asset maintenance. You can use the Enterprise Asset Command Center to:
-
Maximize asset availability:
-
Analyze asset performance metrics.
-
Identify recurring failures and expedite resolution.
-
-
Prioritize work order exceptions:
-
Adjust resource scheduling to avoid schedule delays and cost overruns.
-
-
Respond quickly to material shortages:
-
View spare part requirements and usage trends.
-
Prioritize critical work orders and update material allocations to resolve out-of-stock conditions.
-
The Enterprise Asset Management Command Center improves the visibility of key focus areas, enabling Enterprise Asset Management supervisors to take quick actions in asset maintenance.
Note: You can use the Enterprise Asset Management Command Center only after the installation and common configurations are completed as described in My Oracle Support Knowledge Document 2495053.1, Installing Oracle Enterprise Command Center Framework, Release 12.2. For additional ECC Overview information, see Overview of Oracle Enterprise Command Center Framework, Oracle E-Business Suite User's Guide.
Searching Enterprise Command Center Dashboards
Use the dashboard sidebar to refine (filter) the data on each dashboard. You can also Search using a keyword, value, or a specific record. You can also search using Descriptive Flexfield (DFF) attributes for the following dashboards:
-
Assets Dashboard - Available Refinements: Asset Attributes, Item Instance Flexfield Details
-
Open Work Orders Dashboard - Available Refinement: Work Order Flexfields
-
Materials Dashboard - Available Refinement: Component Information Flexfields
For a list of Enterprise Asset Management flexfields, refer to Configuring Descriptive Flexfields for Search.
In certain dashboards, you can further refine information by searching multiple data sets at once. From the Available Refinements component, click the Options icon and select data sets for the following dashboards:
-
Assets Dashboard - Assets, Asset Attributes, Work Order Assets, Asset Attributes, Collection Results
-
Open Work Orders Dashboard - Work Orders, Work Requests, Collection Results
-
Materials Dashboard - Stores Materials, Stores Work Order, Inventory On-Hand
The type-ahead feature suggests matches for your entry that correspond to the selected data set. When you submit a search, the search term is added to the Selected Refinements list, and the dashboard data is refined to include only records that match the search. You can add multiple refinements and remove any of them at any time. Using Saved Searches, you can create and save your searches and refer to them later. You can also edit and delete saved searches.
Use an asterisk (*) or percent sign (%) to perform a partial keyword or record search that matches any string of zero or more characters. You can also use a question mark (?) to perform a partial search that matches any single character.
Additional Information: For more information about searching for and refining data in enterprise command centers, see Search in Highlights of an Enterprise Command Center, Oracle E-Business Suite User's Guide.
Assets Dashboard
Use the Assets Dashboard to analyze metrics and refine asset performance. Using the Assets Dashboard, you can:
-
Review and update asset activity routing for schedule optimization.
-
Identify recurring failures and define them as activity templates.
-
Track reliability metrics including MTBF and MTTR for assets.
-
Analyze asset life cycle costing and performance trends.
You can view asset metrics, asset charts, and an assets results table. The following is a partial display of the Assets Dashboard.
From the Maintenance Super User responsibility, navigate to the eAM Assets page:
(N) Maintenance Super User > Home > Assets (tab) > Dashboard (sub tab)
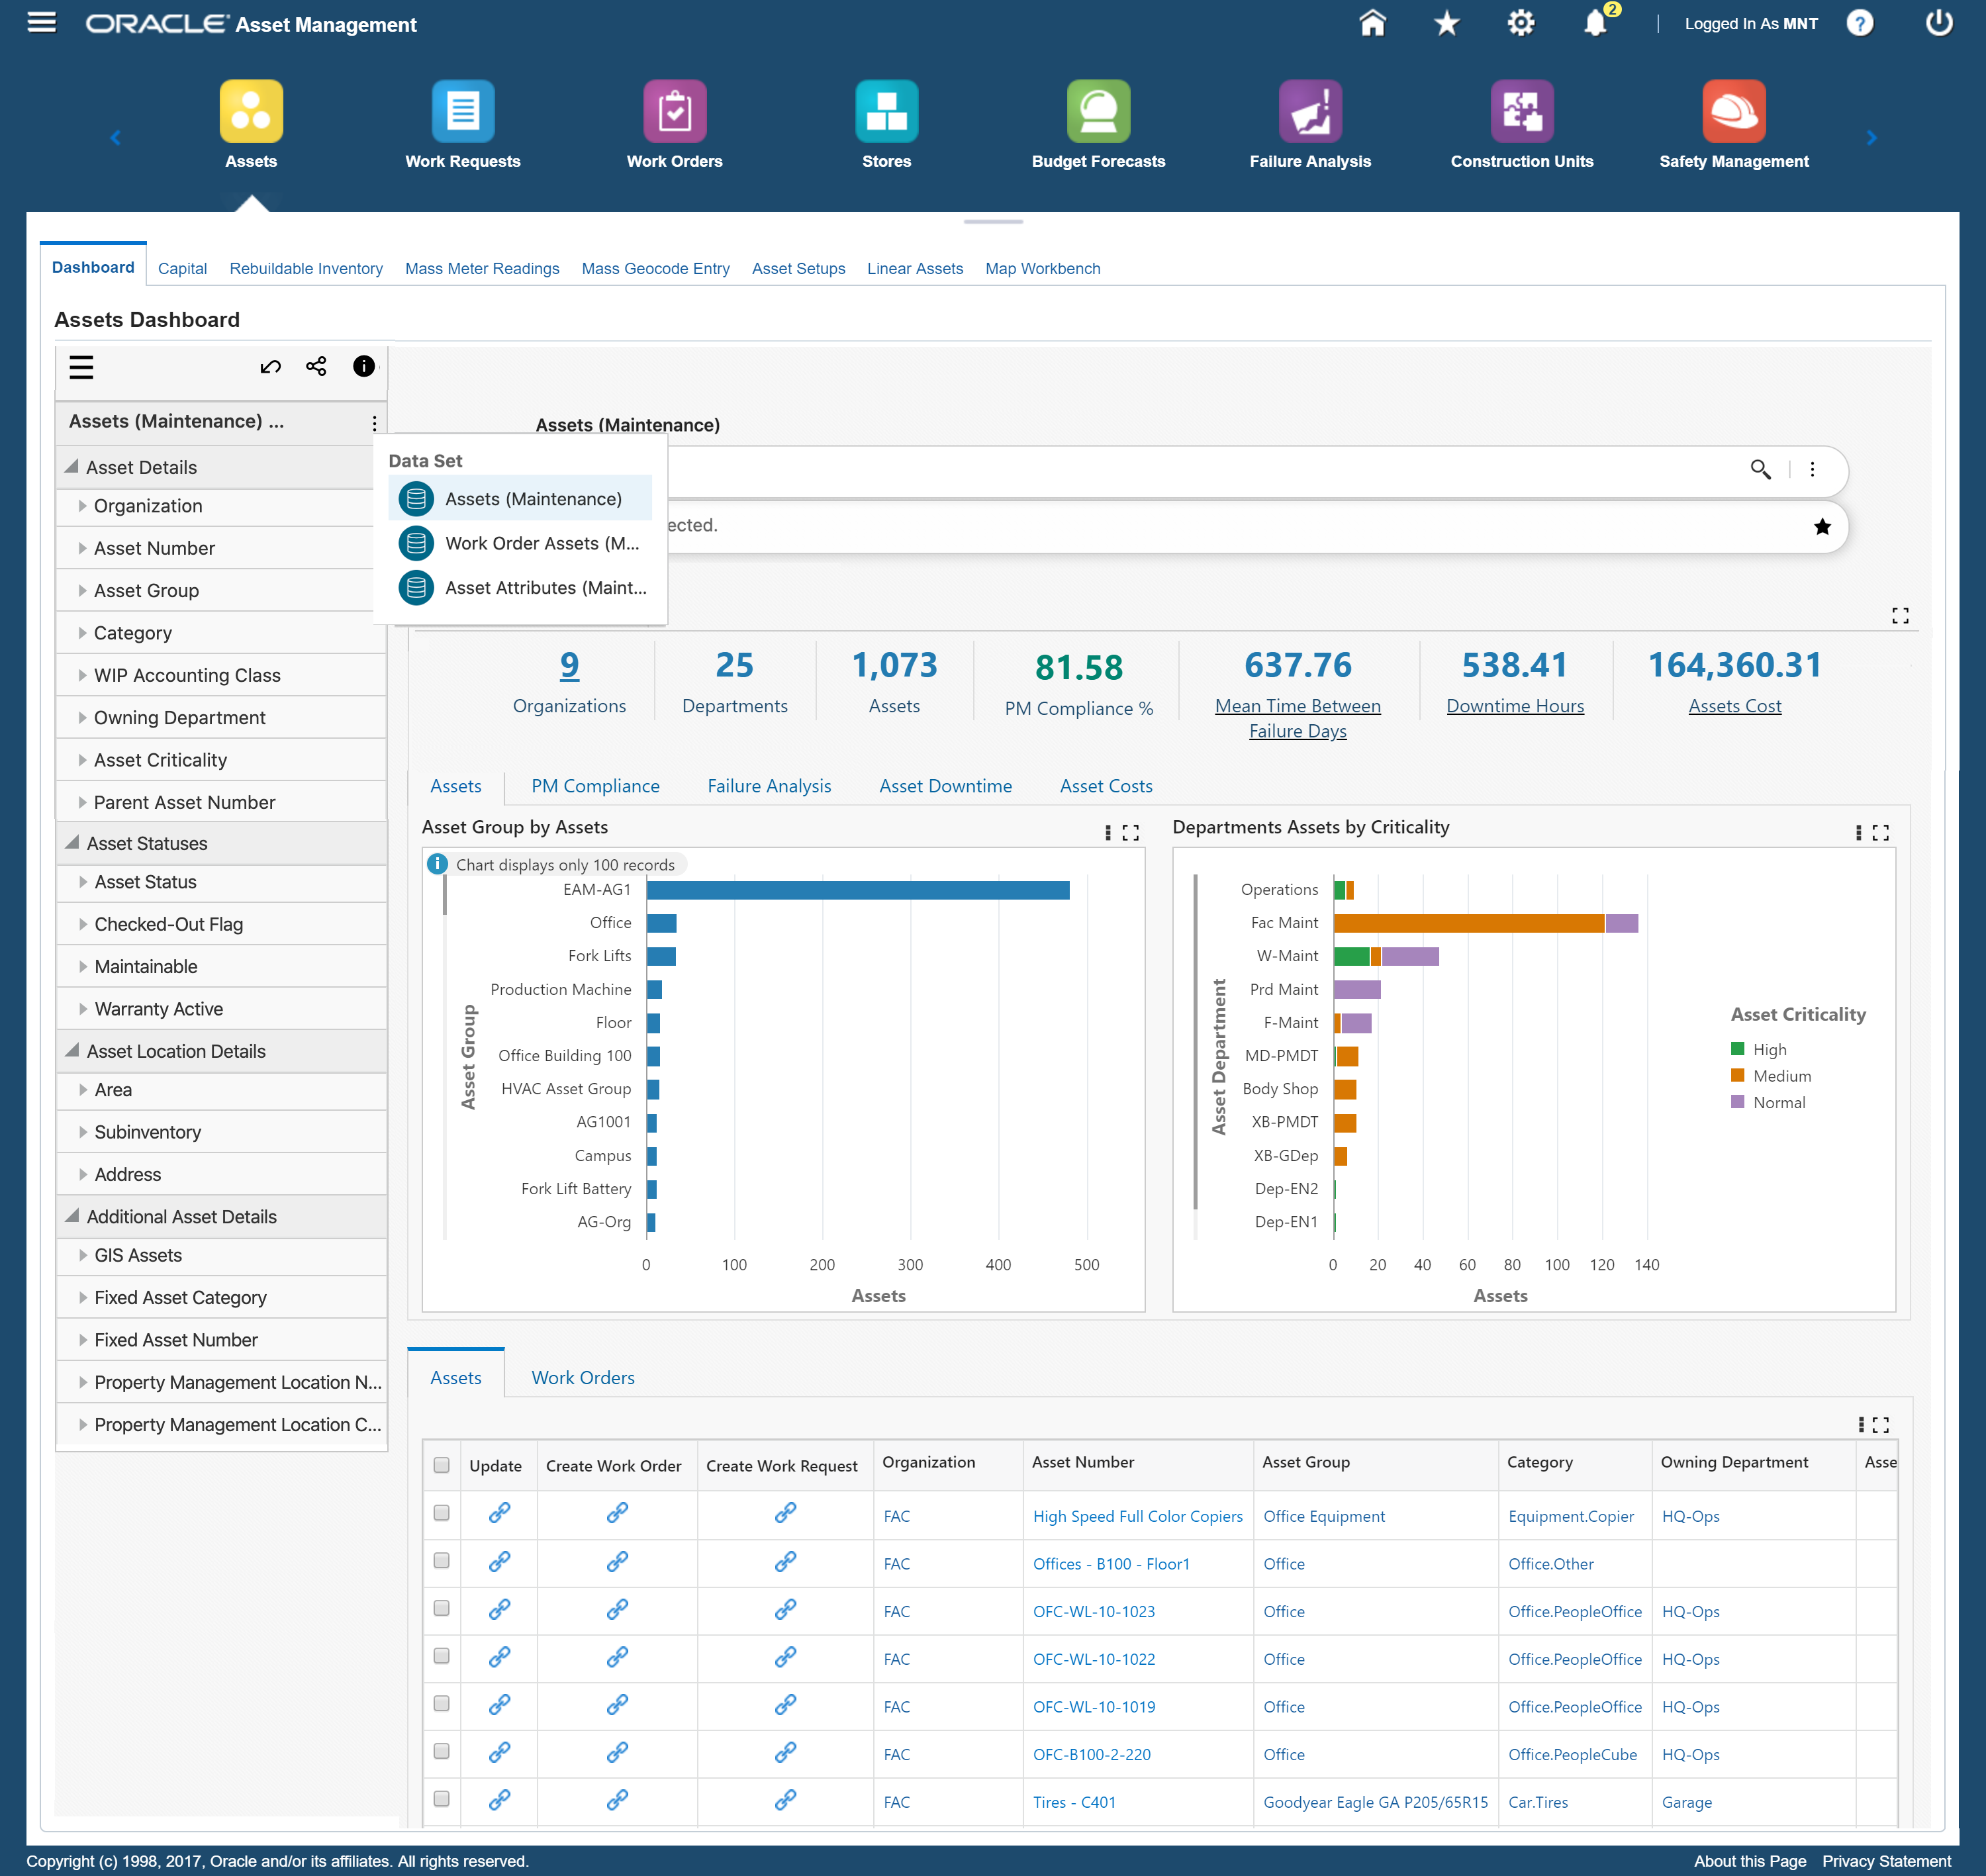
The following table describes the Assets Dashboard components:
| Component | Description |
|---|---|
| Assets (summary bar) | The Assets summary bar displays the following metrics:
|
| Assets (tab layout) | The Asset Group by Assets chart displays the number of active assets for which the organization's current user has access. You can select dimensions to view assets by asset group or asset category.
Note: Unassigned values for the Asset Category attribute are displayed with the value "Blank". You can refine the dashboard data with the blank values. The Departments Assets by Criticality chart displays the number of active assets assigned to the organization's current user and the owning asset department. Note: Unassigned values for the Asset Criticality and Owning Department attributes are displayed with the value "Blank". You can refine the dashboard data with the blank values. |
| PM Compliance (tab layout) | The PM Compliance by Asset Group chart displays the percentage of Preventive Maintenance (PM) work orders in compliance by asset group, calculated from the percentage of total PM work orders completed in time from the total number of work orders with a status of released, complete, complete no-charges, and closed. The Schedule Delay by Activity chart displays the number of Preventive work orders by the number of hours of delay for each activity. It includes work orders associated with a scheduled activity and with a status of released, complete, complete no-charges, and closed. |
| Failure Analysis (tab layout) | The Mean Time Failure Analysis chart displays work orders that have failures. The bars indicate Mean Time Between Failure days (MTBF) by asset group. The lines indicate Mean Time To Repair (MTTR) by asset group. The Failures chart displays failures by MTBF in days, and MTTR in hours. The number of work orders for each asset failure type is reflected by the size of the corresponding bubble. |
| Asset Downtime (tab layout) | The Actual Downtime by Asset Group chart displays actual downtime in hours by asset group. Data is taken from Preventive maintenance work orders with statuses of complete, complete no-charges, and closed. The Others downtime category represents non-PM work orders. |
| Asset Costs (tab layout) | The Actual Cost by Asset Group chart displays the total asset cost by asset group. The Assets Cost by Period chart displays total asset costs by period for all work orders and preventive maintenance work orders. You can select dimensions to view work order cost by year, or work order cost by month. |
| Assets (results table) | The Assets results table displays attributes pertaining to active assets. You can select column values to filter and refine the data.
Note: Unassigned values for the Asset Criticality, Asset Category, and Owning Department attributes are displayed with the value "Blank". You can refine the dashboard data with the blank values. Click the Options icon to Compare selected asset records and Export the data set. Click the Actions icon within a row to:
|
| Work Orders (results table) | The Work Orders results table displays attributes pertaining to work orders.
Note: Unassigned values for the Work Order Type attribute displays with the value "Blank". You can refine the dashboard data with the blank values. Click the Options icon to Compare selected work orders, Export work orders, Print Work Order Report, and Export Schedule from the Export Work Orders page. Click the Actions icon within a row to:
|
Open Work Orders Dashboard
The Open Work Orders Dashboard displays open work order content for Oracle Maintenance.
Note: The default refinement value (deep linking) feature displays limited data for the prior 21 days and the following 21 days. You can override this default value and view all open work orders by removing this refinement.
You can use this dashboard to resolve work order planning and execution alerts, and perform the following tasks:
-
Review and act on work order exceptions such as cost overrun and scheduling delays.
-
Expedite the completion of asset failure and downtime work orders.
-
Resolve material shortage conditions.
-
Analyze and update material and resource requirements for costly work orders.
You can also review and analyze data using Key Performance Indicators (KPIs), performance evaluation metrics, charts, graphs, and tables.
From the Maintenance Super User responsibility, navigate to the Open Work Orders Dashboard:
(N) Maintenance Super User > Work Orders [Tab] > Dashboard (subtab)
Within the Open Work Orders Dashboard, you can search for work orders, work order types, and work order activity. You can analyze data and review work order metrics, alerts, charts, graphs, and tables.
Open Work Orders Dashboard
Work Orders Timeline View
The following table describes the Open Work Orders Dashboard components:
Note: The default refinement value (deep linking) feature displays limited data for the prior 21 days and the following 21 days. You can override this default value and view all open work orders by removing this refinement.
| Component | Description |
|---|---|
| Open Work Orders (summary bar) | The Open Work Orders summary bar displays the following metrics:
|
| Work Orders (tab layout) | The Work Orders by Type chart displays all open work orders grouped by work order type.
Note: Unassigned values for the Work Order by Type and Work Order Type attributes are displayed with the value "Blank". You can refine the dashboard data with the blank values. The Work Orders by Status chart displays all work orders grouped by work order status. The chart defaults to the dimension Work Order Status. Click the Options icon and select dimensions to view and sort this chart by:
Note: The work order status is based on system work order statuses of Draft, Unreleased, On Hold, and Released. Your environment may have different or additional statuses. Each status serves as a metric by which you can filter results. For example, if you click the Released metric, then the application adds the metric to the Selected Refinements component and filters the results by released orders. Note: Unassigned values for the Work Order by Priority attribute displays with the value 'Blank'. You can refine the dashboard data with the blank values. Click the Options icon to export both charts as an image, or in a Comma-Separated Values (CSV) file format. |
| Alerts (tab layout) | The Alert Type Distribution chart displays the number of work orders that have alerts and the associated alert types. For the total alert count, this chart shows the percentage contributed by each alert type with statuses Draft, Un-Released, On Hold, and Released. Move your cursor over each type of work order in the chart to view the number of work orders associated with each type. This chart displays work orders with the following predefined alerts:
The Alerts tag cloud displays alert values for the alert type. For example, Material Shortage is an alert type. In the tag cloud, it displays the item and material name that have shortages. Tag clouds visually represent the number of occurrences of an item or action. The larger the number of occurrences or actions, the larger the alert text and impact. Click the Options icon to export both the chart and tag cloud as an image, or in a Comma-Separated Values (CSV) file format. |
| Assets (tab layout) | The Work Order (Count Distinct) by Asset Group, Work Order Status chart displays the open work orders data by Asset Group and Category combined. This bar chart includes open work orders with conditions and work order status. Click the Options icon and select group dimensions to view and sort this chart by:
Note: Unassigned values for the Asset Area and Asset Category attributes are displayed with the value "Blank". You can refine the dashboard data with the blank values. You can also click the Options icon to export the chart as an image, or in a Comma-Separated Values (CSV) file format. |
| Failures (tab layout) | The Work Order (Count Distinct) by Failure Code, Work Order Status chart displays open work orders data by Failure Code and Cause Code combined. This bar chart includes open work orders and work order status. Click the Options icon to export the chart as an image, or in a Comma-Separated Values (CSV) file format. |
| Work Orders (results table) | The Work Orders results table displays all work orders that are in an open status. The open statuses include Draft, Unreleased, On Hold, and Released. Sort order of the table is based on the scheduled start date in ascending order. The Work Orders results table also displays the top ten records for material shortage (materials with top 10 shortage quantities are displayed in this results table). The results table displays data based on attribute grouping. You can select the following attribute groups from the drop-down menu:
In the Work Orders results table header, click the Options icon to Export work orders, Compare work orders, Print a Work Order Report, Export Schedule from the Export Work Orders page, perform a Mass Status Update, and navigate to the Scheduler Workbench. Navigation to the eAM Oracle Application Framework (OAF) Scheduler Workbench enables you to quickly and easily update the schedule dates for the selected work order and operations, and navigate back to the Open Work Orders dashboard. Click the Record Details icon within a row to select that row and open the Record Details dialog box. You can view work order details for the selected row. Note: To mass update the work order status, select multiple work orders with the same status and within the same organization, and then click Mass Status Update. The Work Order Mass Status Update dialog box appears. Select a status from the To Status drop-down menu and then click Submit. The application updates the work order status in Oracle E-Business Suite (EBS) and immediately updates the Command Center values. Click the Actions ellipsis icon (…) within a selected row and click:
In the Work Orders results table header, you can also click the Timeline View icon to view work orders by date. Each event node displays the Work Order Number in the title. The Work Order Status, Alert Type, and Scheduled Start Date display in the description. You can hover over each work order in the Timeline View to view additional work order details. The Timeline View is useful as a chronological representation of work orders. You can also right click on each work order in the Timeline View and then click:
|
| Work Order Cost Estimate Details (results table) | The Work Order Cost Estimate Details results table displays open work orders that have estimated costs. The Open statuses include Draft, Unreleased, On Hold, and Released. Sort order of the table is based on the estimated total cost in descending order. Click the ellipsis (…) action link within a selected row and then click the Update action to navigate to the Work Order page to view information and update the selected work order. In the Update Work Order page, you can review the alert condition and implement the necessary details to fix the alert condition. This results table also displays the top ten most expensive materials and resources from a selected work order. Click the ellipsis (…) action link within a selected row and then click the Requirements action to navigate to the Top 10 Requirements by Estimated Costs window to view the top ten materials by Material Name, Quantity, and Amount in descending order, followed by the top ten Resource Names, Usage, and Amount in descending order from the selected work order. Click the Options icon to Compare work orders, Export work orders, Print Work Order Report, and Export Schedule from the Export Work Orders page. |
| Work Requests (results table) | The Work Requests results table displays work requests with statuses that include Awaiting Work Order and On Work Order.
Note: Unassigned values for the Asset Criticality attribute displays with the value 'Blank'. You can refine the dashboard data with the blank values. Click the Options icon to Compare work orders and Export a schedule from the Export Work Orders page. Click the Actions ellipsis (…) icon within a selected row to:
|
Materials Dashboard
Use the Materials Dashboard from the Stores tab to search for items, item details, and activity. This dashboard provides improved and responsive material management by considering maintenance criticality and usage patterns. You can use the Materials Dashboard to:
-
Perform material allocation updates based on work order priority.
-
Manage shortage conditions through inventory from other stock sources.
-
Review unplanned material usage and update bills of material.
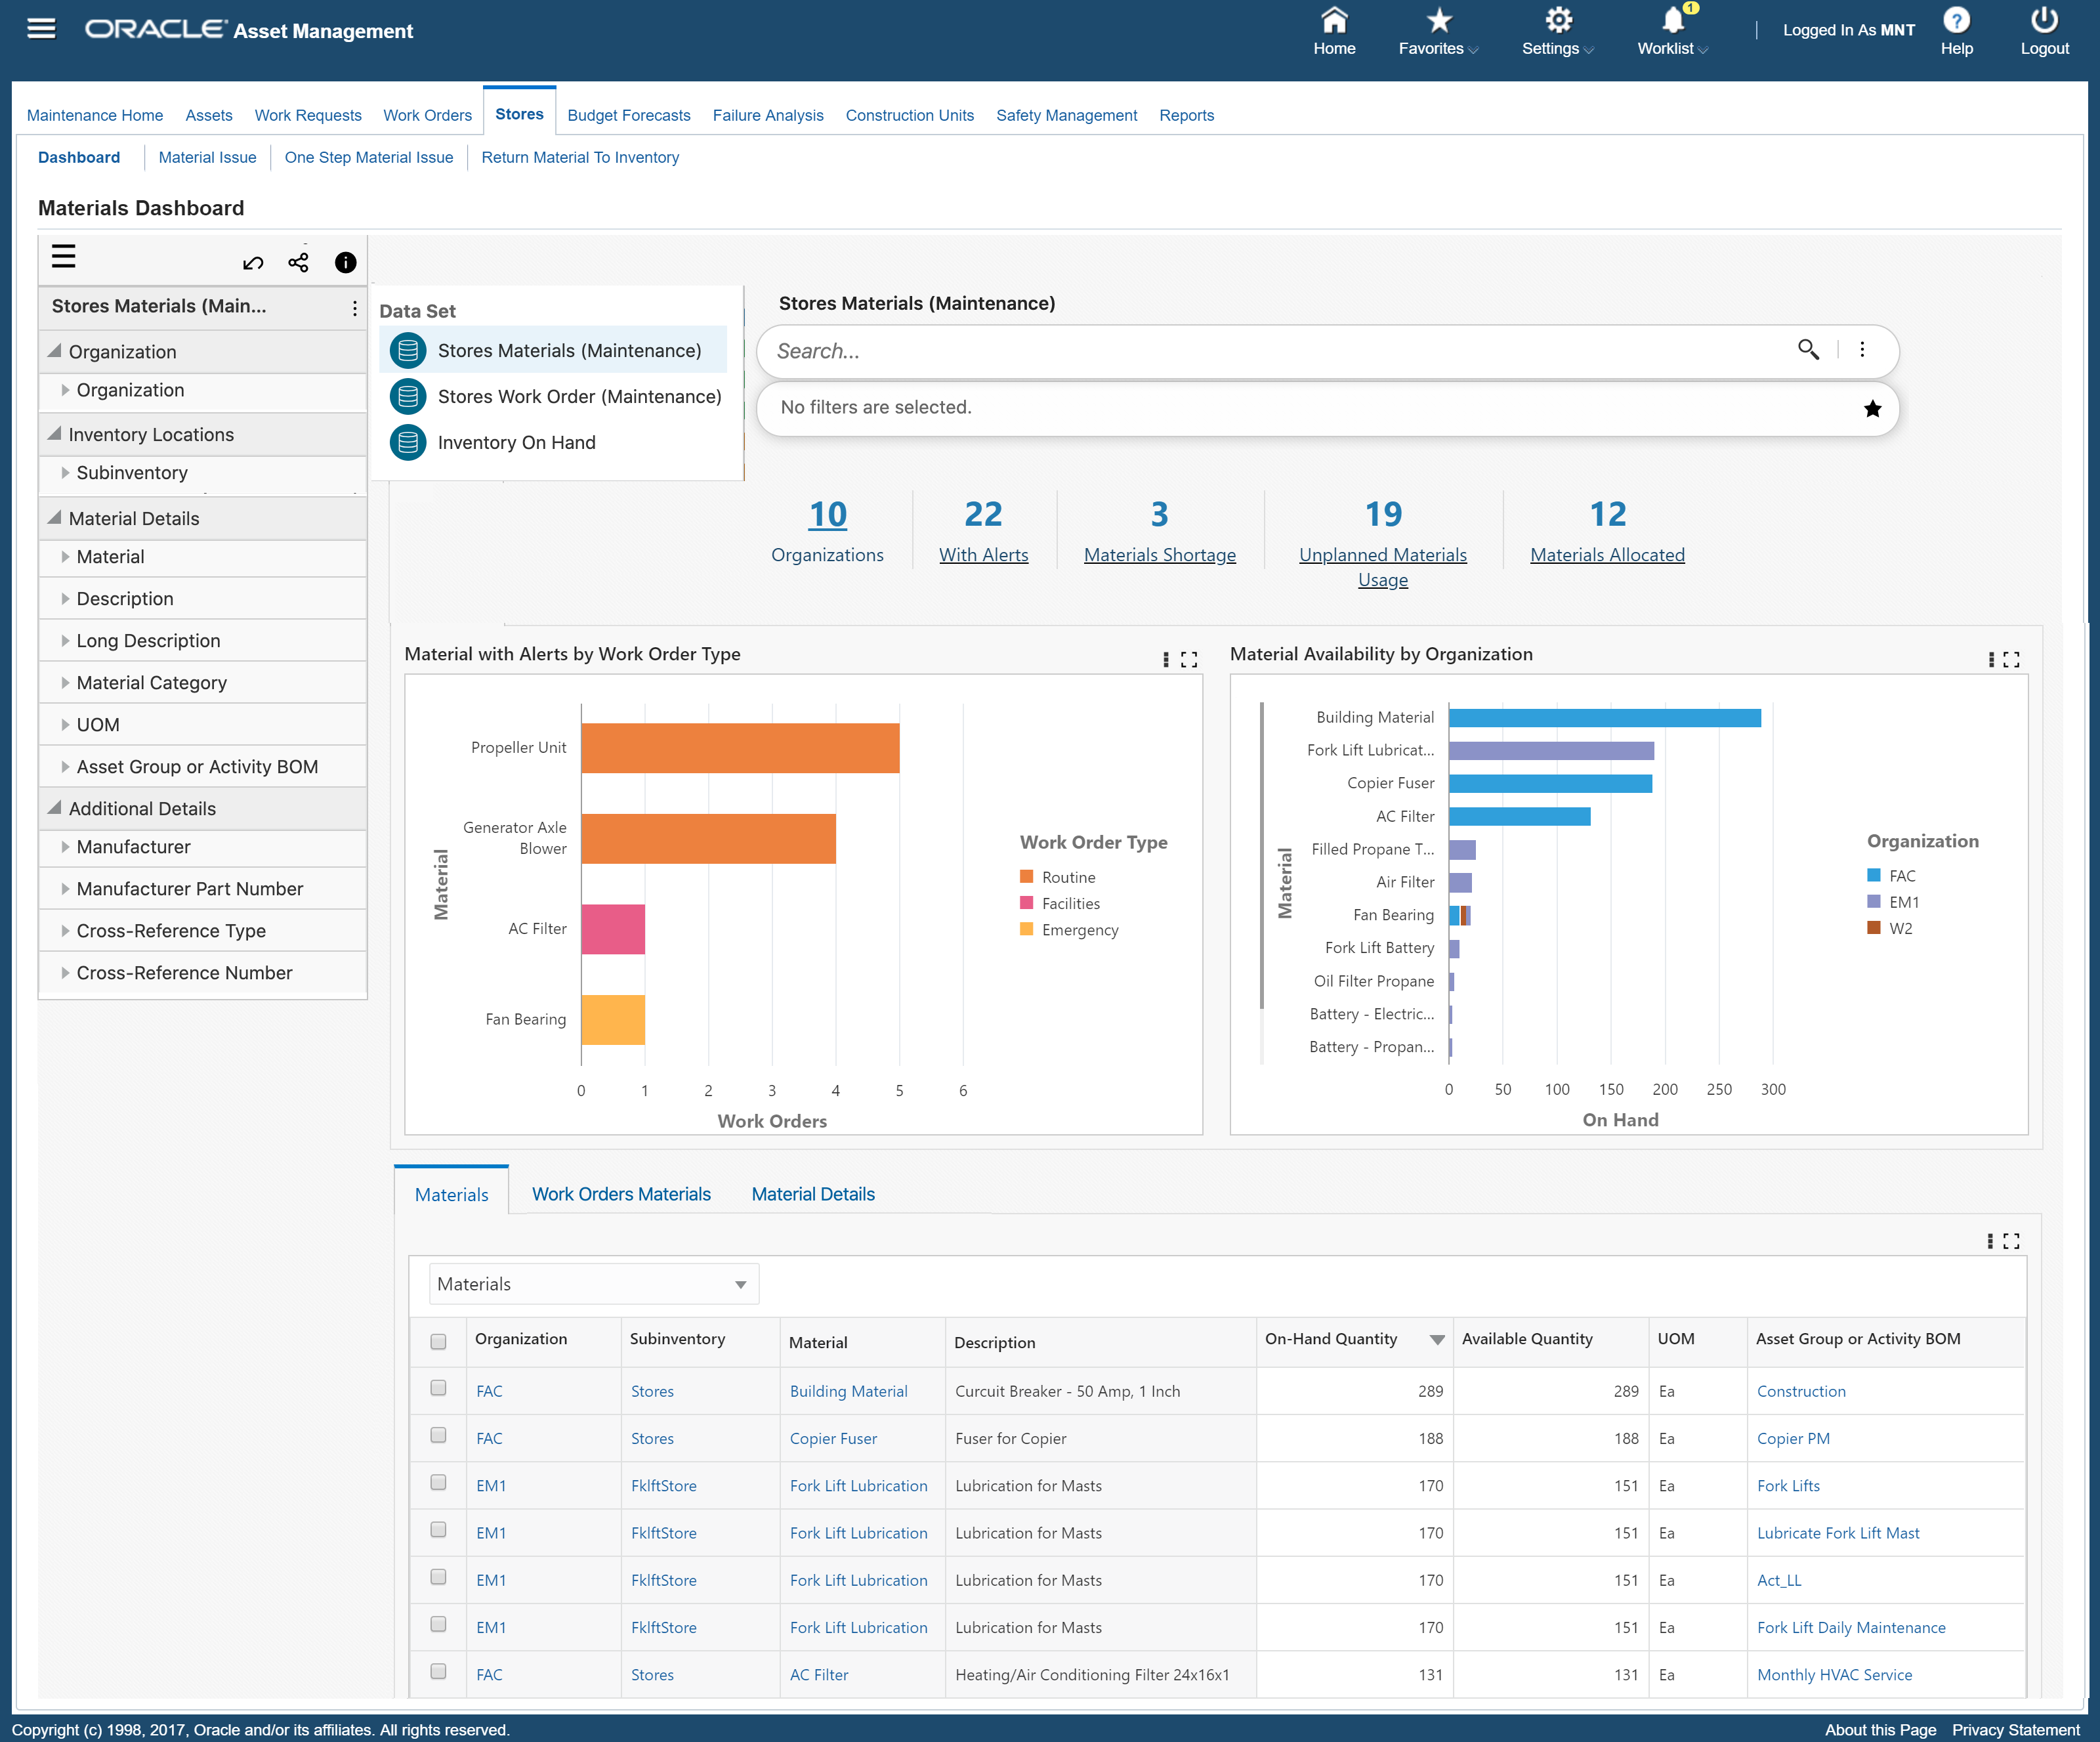
You can also view item metrics. subinventories, and an item results table. The following is a partial display of the Materials Dashboard.
From the Maintenance Super User responsibility, navigate to the Materials Dashboard:
(N) Maintenance Super User > Home > Stores (Tab) > Dashboard [Tab]
Materials Dashboard
The following describes the Materials Dashboard components:
| Component | Description |
|---|---|
| Materials (summary bar) | The Materials summary bar displays the following metrics:
|
| Charts | The Material with Alerts by Work Order Type chart displays the number of work orders with material shortage and excess material used. Click the Options icon and select group dimensions to view and sort this chart by:
Note: Unassigned values for the Work Order by Type and Work Order by Priority attributes are displayed with the value "Blank". You can refine the dashboard data with the blank values. The Material Availability by Organization chart displays material on-hand quantity and material names, sorted by organizations owning the materials. This chart displays on-hand material by subinventory when you click on an organization that displays on the chart. Click the Options icon and select group dimensions to view and sort this chart by:
You can also click the Options icon to export both charts as an image, or in a Comma-Separated Values (CSV) file format. |
| Materials (results table) | The Materials results table displays attributes pertaining to item details. From the drop-down menu, you can select Miscellaneous to view materials grouped by miscellaneous attributes. Click the Options icon to:
|
| Work Orders Materials (results table) | The Work Orders Materials results table displays attributes pertaining to work order details. This results table displays materials, materials allocation, and material shortage. From the drop-down menu, you can select Materials Details and Actions to view orders grouped by material detail and action attributes. Navigate to Work Order Details and Actions from the drop-down menu to view additional information.
Note: Material shortage in ECC displays based on the availability of material in subinventory entered in the work order. Note: Unassigned values for the Work Order Type attribute displays with the value 'Blank'. You can refine the dashboard data with the blank values. Click the Options icon to Compare work orders, Export work orders, Print Work Order Report, and Export Schedule. Note: This results table includes the following action-enabled attributes:
Note: From the Work Order Details and Actions view, you can perform the following additional actions:
|
| Material Details (results table) | The Material Details results table displays attributes pertaining to on-hand quantity information at the locator and lot levels. You can also search by locator or lot number. Click the column attributes to refine the dashboard data for the selected materials. Click the Options icon to Compare and Export selected materials. Note: The Materials Details results table and refinements are available only when Inventory Management Command Center is implemented. Material Details results table displays details for all EAM enabled organizations irrespective of responsibility access. |