Oracle Landed Cost Management Command Center
Landed Cost Management Command Center User Interface
Overview
The Landed Cost Management Command Center provides tools to load and analyze the landed cost data, and extract valuable insights for supply and product margin management. The Landed Cost Dashboard enables you to determine how extended supply chain cost factors are being absorbed into item costs. You can easily identify the top items, component distribution, and a historic summary of estimated, actual, and unmatched (yet to be applied in invoices) amounts.
Using the Landed Cost Dashboard, you can:
-
Identify amounts being invested in charges during the procurement cycle.
-
Identify the landed cost distribution profile for items while considering variables such as country of origin, third party suppliers, receiving organizations, and so on.
-
Review trends and variances from estimated to invoiced information.
-
Display non-planned cost factors that have been billed without the corresponded estimated amounts.
-
Search for historic landed cost information of an item to drive future sourcing negotiations.
Note: You can use the Landed Cost Management Command Center only after the installation and common configurations are completed as described in My Oracle Support Knowledge Document 2495053.1, Installing Oracle Enterprise Command Center Framework, Release 12.2. For additional ECC Overview information, see Overview of Oracle Enterprise Command Center Framework, Oracle E-Business Suite User's Guide.
Searching Enterprise Command Center Dashboards
Use the dashboard sidebar to refine (filter) the data on each dashboard. You can also Search using a keyword, value, or a specific record. The type-ahead feature suggests matches for your entry that correspond to the selected data set. When you submit a search, the search term is added to the Selected Refinements list, and the dashboard data is refined to include only records that match the search. You can add multiple refinements and remove any of them at any time. Using Saved Searches, you can create and save your searches and refer to them later. You can also edit and delete saved searches.
Use an asterisk (*) or percent sign (%) to perform a partial keyword or record search that matches any string of zero or more characters. You can also use a question mark (?) to perform a partial search that matches any single character.
Additional Information: For more information about searching for and refining data in enterprise command centers, see Search in Highlights of an Enterprise Command Center, Oracle E-Business Suite User's Guide.
Landed Cost Dashboard
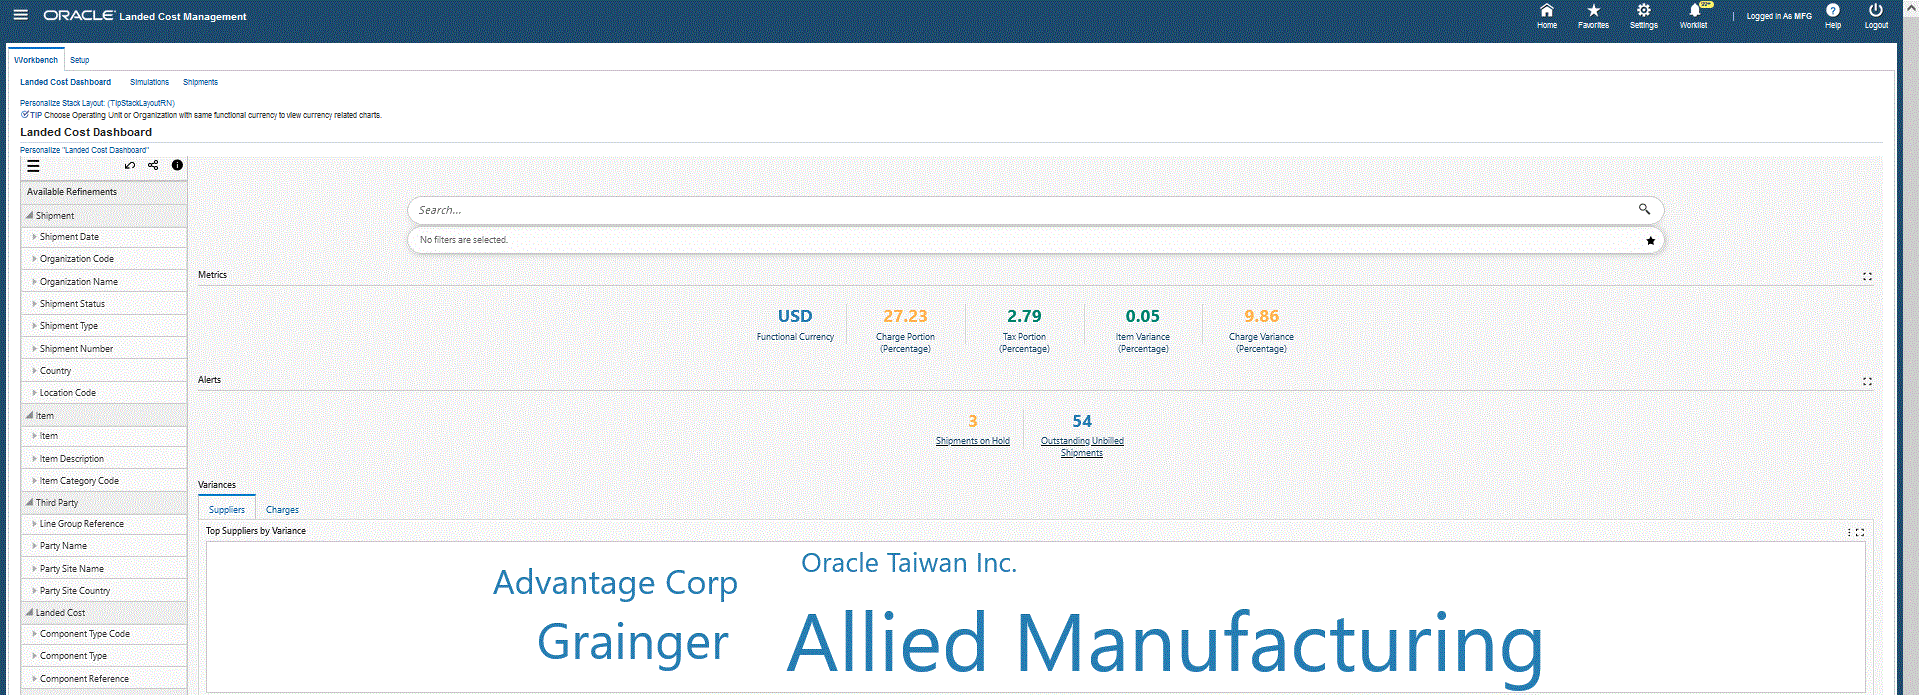
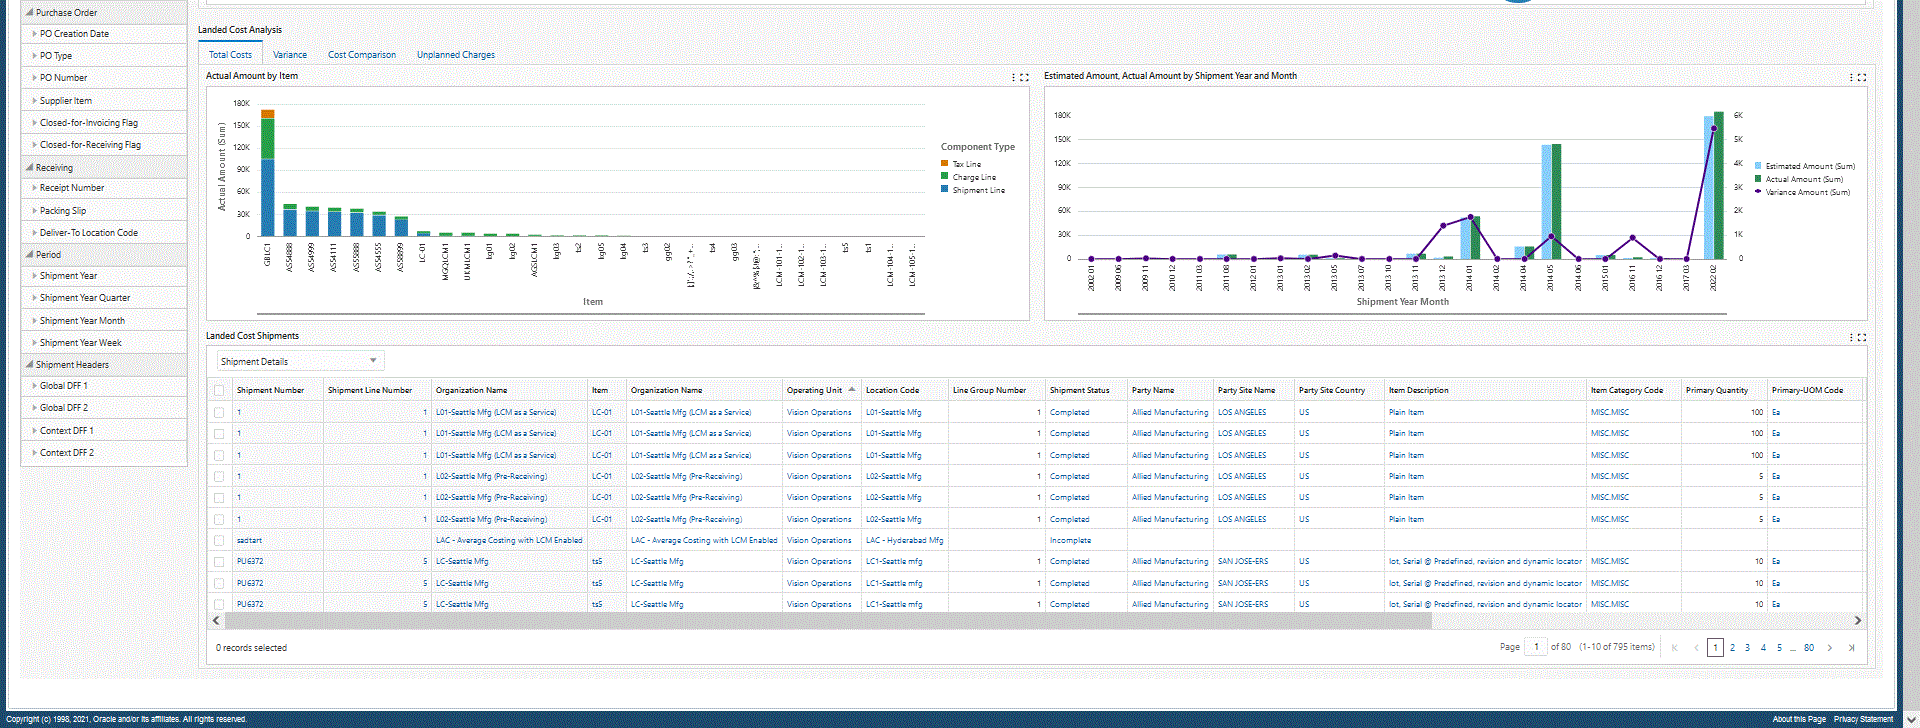
Use the Landed Cost Dashboard to view Estimated Landed Cost (ELC), Actual Landed Cost (ALC), ALC and ELC variances, cost comparison, unplanned charges and their value. You can view landed cost metrics, charts, and a landed cost results table. The following is a partial display of the Landed Cost Dashboard.
From the Landed Cost Management responsibility, navigate to the Landed Cost Management page:
(N) Landed Cost Management > Workbench > Landed Cost Dashboard > Workbench (Tab) > Landed Cost Dashboard (Subtab)


The following table describes the Landed Cost Dashboard regions and components:
| Component | Description |
|---|---|
| Metrics (summary bar) | The Landed Cost summary bar displays the following metrics:
|
| Alerts (summary bar) | The Alerts summary bar displays the following alerts:
|
| Variances (tab layout) Suppliers (tab) |
The Top Suppliers by Variance tag cloud displays the top 15 suppliers by variance amount (actual less estimate amount). You can click on a supplier to refine and filter the data by that supplier. |
| Variances (tab layout) Charges (tab) |
The Top Charges by Variance tag cloud displays the top charges by variance percent ((actual less estimate amount)/estimate amount)). You can click a charge type to refine and filter the data by that charge type. |
| Landed Cost Analysis (tab layout) Total Costs (tab) |
The Actual Amount by Item chart displays total actual costs of items. Click the Options icon to select metrics and dimensions values to filter and display cost data. The Estimated Amount, Actual Amount by Shipment Year and Month chart displays estimated and actual total costs of items. Click the Options icon to select dimension values to filter and display cost data. The Landed Cost Shipments results table displays shipping attributes. From the drop-down list, you can select views to display shipments by:
You can also click attribute values in the table to further refine and filter dashboard data. Note: Click the Options icon to Export the data set to a CSV file. You can also click Manage Shipments to navigate to the Shipments page and update shipment information. |
| Landed Cost Analysis (tab layout) Variance (tab) |
The Unit ELC, Unit ALC by Shipment Year and Month chart displays unit Estimated Landed Cost and unit Actual Landed Cost amounts. Click the Options icon to select various dimension values to filter and display cost data. The Variance Amount, Variance Percentage by Shipment Year and Month chart displays variance amounts and variance percentage. Click the Options icon to select various dimension values to filter and display variance data. The Shipment Costs results table displays shipping cost attributes. Click attribute values in the table to further refine and filter dashboard data. Note: Click the Options icon to Export the data set to a CSV file. You can also click Manage Shipments to navigate to the Shipments page to update shipment information. |
| Landed Cost Analysis (tab layout) Cost Comparison (tab) |
The History of Unit ALC by Shipment Year and Month chart displays historical unit Actual Landed Cost amounts. Click the Options icon to select dimension and metrics values to filter and display historical Actual Landed Cost data. The Cost Comparison results table allows you to view and compare cost attributes. From the drop-down list, you can select views to display shipments by:
You can also click attribute values in the table to further refine and filter dashboard data. Note: Click the Options icon to Export the data set to a CSV file. You can also click Manage Shipments to navigate to the Shipments page to update shipment information. |
| Landed Cost Analysis (tab layout) Unplanned Charges (tab) |
The Unplanned Charges chart displays total unplanned charges. Click the Options icon to select dimension and metrics values to filter and display unplanned charges data. The Unplanned Charges results table displays attributes pertaining to unplanned charges. From the drop-down list, you can select views to display shipments by:
Click the Options icon to Compare selected records or Export the data set. You can also click Manage Shipments to navigate to the Shipments page to update shipping information. Note: Click the Options icon to Export the data set to a CSV file. You can also click Manage Shipments to navigate to the Shipments page to update shipment information. |