Asset Performance Dashboard
Overview of Asset Performance Dashboard
Asset Performance Dashboard provides reporting capabilities for production and maintenance assets within an organization. The dashboard displays the reports for the shop floor events such as breakdown, excessive scrap, unstable equipment and also details of asset status, production performance, output, scrap, and operating parameters.
Asset Performance Dashboard is a role-based dashboard for plant managers, providing an insight into:
-
360 degree view of equipment performance of production and non-production assets.
-
Events, asset detail status trend, asset downtime analysis, asset production performance, asset output and scrap, and asset operational parameters for production assets.
-
Events, asset detail status trend, asset downtime analysis, asset operational parameters for non-production assets.
It provides the following business values:
-
Out-of-box dashboard for monitoring performance of production and non-production assets.
-
Track equipment events and alarms on shop floor exceptions such as equipment down, excessive scrap or unstable equipment.
-
Monitor Overall Equipment Effectiveness (OEE).
-
Monitor critical process parameters and raise alerts for exceptions.
-
Overall visibility of equipment health in a maintenance organization.
-
User friendly tool to create ad hoc reports.
Asset Performance Dashboard shows performance information of a production asset. It consists of Production Assets tab and Non-Production Assets tab.
Production Assets
The Production Asset tab has several sections:
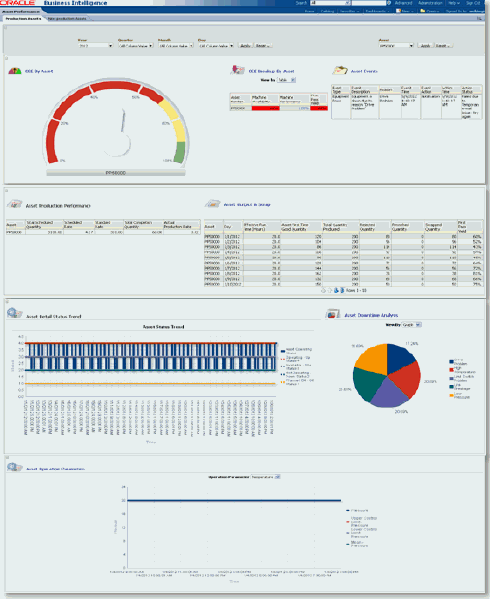
The first section shows the time prompts and the asset prompt that contain only the list of production assets. The default value for the time prompt is the previous month.

The second section shows three charts: OEE By Asset, OEE Breakup by Asset and Asset Events. The OEE by Asset chart shows a gauge indicating the OEE value for the selected production asset. The OEE Breakup chart shows Machine Availability, Machine Performance, and First Pass Yield values in a table format or a bar chart where table format defaults. You can navigate to the Machine Availability Details page, Machine Performance Details page, and First Pass Yield Details page by clicking on the links in the respective tables in Machine Availability, Machine Performance, and First Pass Yield columns, respectively. The third chart is Asset Events.
Asset Production Performance and Asset Output and Scrap are the two reports that you can generate from the third section.
The next section provides two reports such as Asset Details Status Trend and Asset Downtime Analysis. The Asset Downtime Analysis pie chart shows the percentage of down time by downtime reason. The Machine Availability Ratio Trend chart shows the daily values of machine availability ratio ranging from 0% to 100%.
Following are the reports available from the Production Asset page:
-
OEE By Asset.
-
OEE Breakup by Asset.
-
Asset Events.
-
Asset Production Performance.
-
Asset Output and Scrap.
-
Asset Status Trend.
-
Asset Downtime Analysis.
-
Asset Operation Parameter Trend.
The OEE By Asset chart shows a gauge indicating the OEE value for the selected production asset.
The OEE breakup chart shows Machine Availability, Machine Performance, and First Pass Yield values in a table format or a bar chart where table format defaults. You can drill down into Machine Availability Details page, Machine Performance Details page, and First Pass Yield Details page by clicking on the links in the table under Machine Availability, Machine Performance, and First Pass Yield columns, respectively.
Asset Events chart displays the details of events triggered for the assets such as time, description of events, reasons for the events and event actions. Manufacturing Operations Center (MOC) provides two seeded event actions, such as creation of work request in Oracle Enterprise Asset Management Application and Mail Notification.
The Asset Production Performance report compares the actual production rate and the completion quantity with the scheduled quantity and standard rate.
Asset Output and Scrap report shows the total quantity produced by the production asset, rejected quantity, scrap quantity, reworked quantity, and first pass yield.
The Asset Status Trend chart shows trend of run time, idle time, down time and off time in hours. The Asset Downtime Analysis pie chart shows percentage of down time by downtime reasons.
Asset Operation Parameters show the trend of a selected operation parameter from the operation parameter prompt, which consists of a list of operation parameters seeded for Extensible Attribute in MOC. These parameters include pressure, temperature, RPM, length, width, thickness, and weight.
Non-Production Assets
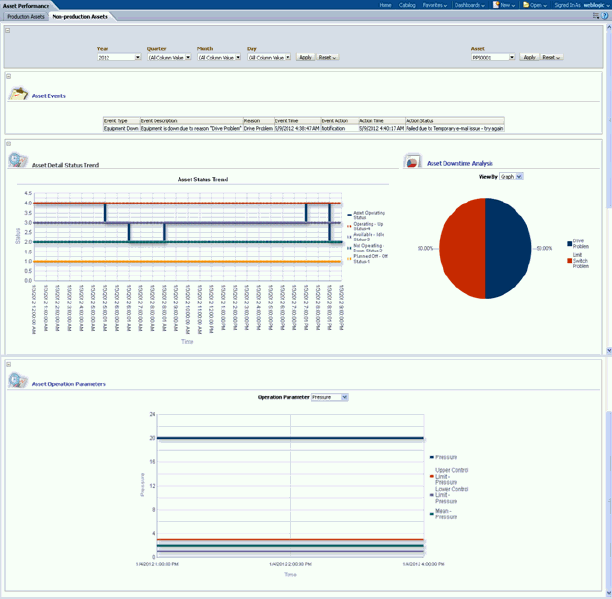
The Non-Production Asset tab of Asset Performance dashboard shows performance information for a selected non-production asset.

Following are the reports available from the Non-Production Asset page:
-
Asset Events.
-
Asset Status Trend.
-
Asset Downtime Analysis.
-
Asset Operation Parameter Trend.
The default value of selected time period is the previous month from the current date. The Asset prompt contains a list of non-production only assets.
The Asset Events region displays all the events generated for assets.
The Asset Detail Status Trend region shows two charts: The Asset Status Trend chart and Asset Downtime Analysis chart. The Asset Status Trend chart shows the trend of run time, idle time, down time, and off time in hours. The Asset Downtime Analysis pie chart shows the percentage of down time by downtime reasons.
The Asset Operation Parameters region shows the daily chart of a selected operation parameter from the operation parameter prompt, which consists of a list of operation parameters seeded for Extensible Attribute in MOC. These parameters include pressure, temperature, RPM, length, width, thickness, and weight.