Process Engineer Dashboard
Overview of Process Engineer Dashboard
The Process Engineer Dashboard enables plant engineers to view the summarized information of process parameters and help to answer queries such as the average value of temperature or pressure running on a particular equipment in the last hour. It also allows correlation between equipment output, status and the influencing variables.
From the Process Engineer Dashboard, you can view the reports based on the following dimensions:
-
Time dimension – Year, Quarter, Month and Day
-
Equipment dimension – Plant, Department and Equipment

Parameter Hourly Run Chart
The Parameter Hourly Run Chart report displays the hourly values of the summarized extensible attribute. The report can be run for multiple attributes. The Attribute Name list of values displays only those attributes that have transaction records.

Equipment Output - Process Analysis
The equipment output tabular report displays the hourly values of the summarized extensible attributes along with the output summary information. The report can be run for multiple attributes and a specific date. The data from the output summary such as the completed quantity, scrap quantity, output quantity, etc, are also displayed for correlation between equipment output and process parameters.

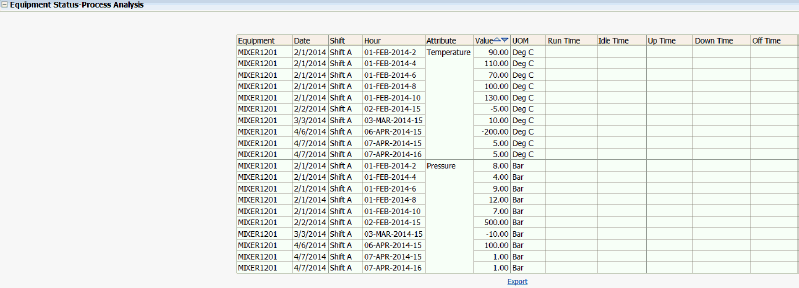
Equipment Status - Process Analysis
The equipment status tabular report displays the hourly values of the summarized extensible attribute(s) along with status summary information. The report can be run for multiple attributes and a specific date. The data from the status summary such as Up hours, Down Hours, Idle hours are displayed to correlate data between equipment status and process parameters.
