Performance-Driven Planning Features
This chapter covers the following topics:
- Introduction
- Oracle Real Application Clusters
- Parallel Execution of SQL and DML
- Planning Analytics
- Advanced Visualization Capabilities for APCC
Introduction
When deployed on Oracle Exadata and Oracle Exalytics hardware, PDP enables the following features:
-
Full support of Oracle Real Application Clusters in the following products:
-
Oracle Advanced Supply Chain Planning
-
Oracle Inventory Optimization
-
Oracle Service Parts Planning
-
Oracle Global Order Promising
-
Oracle Advanced Planning Command Center
Note: These features are available when Planning Command Center for Oracle Engineered Systems is deployed in Oracle Exadata hardware.
-
-
Parallel Execution of queries and Data Manipulation Language (DML) in the following products:
-
Oracle Advanced Supply Chain Planning
-
Oracle Inventory Optimization
-
Oracle Service Parts Planning
-
Oracle Global Order Promising
-
Oracle Advanced Planning Command Center
Note: These features are available when Planning Command Center for Oracle Engineered Systems is deployed in Oracle Exadata hardware.
-
-
Visualization capabilities in Advanced Planning Command Center
Oracle Real Application Clusters
The following VCP products support Oracle Real Application Clusters (RAC), but in a limited capacity (single-nodes only):
-
Advanced Supply Chain Planning
-
Inventory Optimization
-
Service Parts Planning
-
Global Order Promising
-
Advanced Planning Command Center
When these products are deployed with PDP or Oracle Distribution Requirement Planning (DRP) on Oracle Exadata, they support the multi-node RAC architecture.
For more information, see the Oracle Real Application Clusters Administration and Deployment Guide.
Parallel Execution of SQL and DML
Hardware systems like Oracle Exa hardware have large amounts of memory capacity. The aggregated database buffer cache of an RAC environment supports the caching of objects of up to one terabyte.
In-Memory Parallel Execution (In-Memory PX) introduced in Oracle Database 11g Release 2, takes advantage of this large aggregated database buffer cache.
Planning Command Center for Oracle Engineered Systems enables Parallel Execution of SQL queries and DML in three key areas where there are requirements of large batch processing:
-
Collections
-
Snapshot
-
Plan Archival of APCC
The VCP data tables will have parallelism enabled and the degree of parallelism will have a default standard (Auto Degree of Parallelism).
Planning Analytics
Deployed on Oracle Exadata In-Memory Database, Oracle Value Chain Planning’s In-Memory Performance Driven Planning enables you to create a personalized watch list of key performance indicators with configurable thresholds that notify you when certain specific exception conditions occur. Operational planners receive immediate alerts when plan results deviate from enterprise targets or from previous plans.
Advanced Visualization Capabilities for APCC
PDP contains charts which provide advanced visualization capabilities for APCC. These charts help you visualize dense multi-dimensional, multi-page data on a single screen and provide multiple visualizations across a common axis scale for easy comparison.
PDP contains three seeded charts:
-
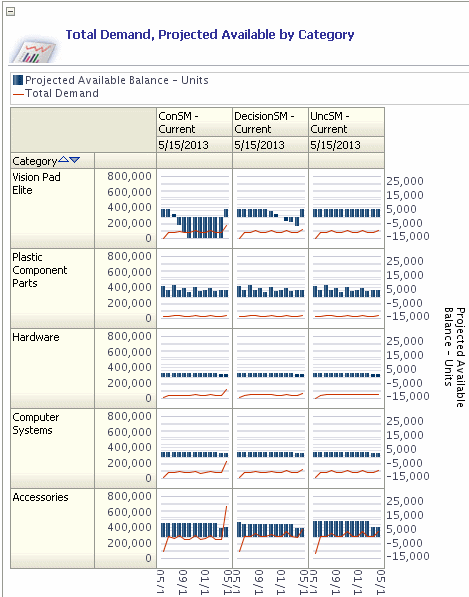
Total Demand, Projected Availability by Category
-
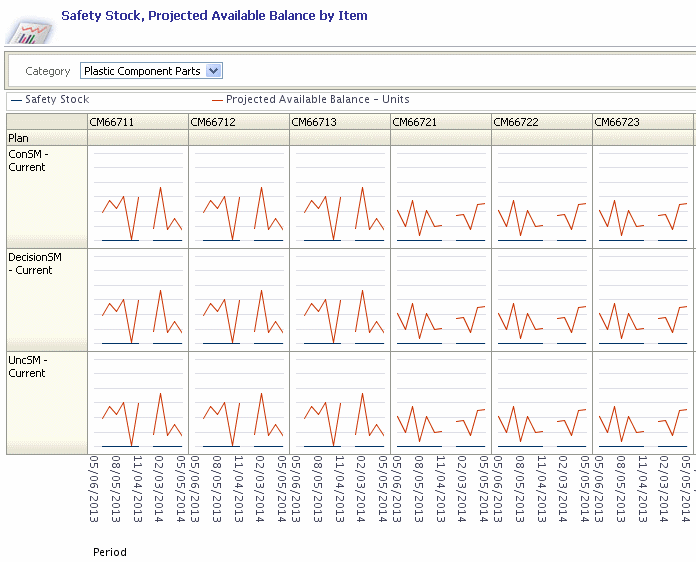
Safety Stock, Projected Available Balance by Item
-
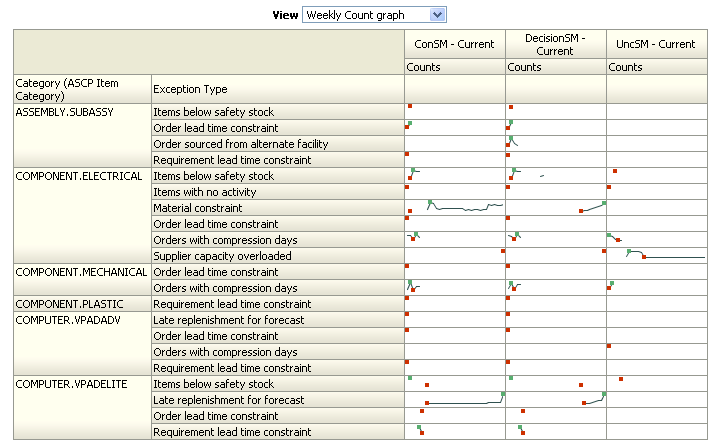
Exception Summary
Total Demand, Projected Availability by Category
This report can be accessed in the Plan Health Summary tab of the Supply Chain Analyst dashboard. This chart shows an area-type graph and displays the following:
-
Total Demand
-
Projected Available Balance – Units
The enabled dimensions are as follows:
-
Plan (Base Plan and Compare Plans selected in the page prompts)
-
Categories (Filtered based on page prompts)
-
Organizations (Filtered based on page prompts)
The following is an example of the Total Demand, Projected Availability by Category chart:

Safety Stock, Projected Available Balance by Item
This report can be accessed in the Plan Health Summary tab of the Supply Chain Analyst dashboard. This chart shows an area-type graph and displays the following:
-
Safety Stock
-
Projected Available Balance – Units
The enabled dimensions are as follows:
-
Plan (Base Plan and Compare Plans selected in the page prompts)
-
Categories (Filtered based on page prompts)
-
Organizations (Filtered based on page prompts)
The following is an example of the Safety Stock, Projected Available Balance by Item chart:

Exception Summary
This report can be accessed in the Exceptions tab of the Supply Chain Analyst dashboard. This chart shows an area-type graph and displays the following:
-
Exception count
-
Exception value
The enabled dimensions are as follows:
-
Plan (Base Plan and the comparison plans selected in page prompts)
-
Category
-
Exception Type
The following is an example of the Exception Summary chart:
