Auditability
Overview of Activity Auditing
The Activity Audit dashboard gives full insight into the use of the Enterprise Command Center dashboards. It allows business analysts and administrators to know whether dashboards are being used or not, who uses them, and at what times and which dashboard is used more. It also helps generate valuable new insights into user searches.
Activity Audit provides the following benefits:
-
Capitalize on ECC investment
-
Track dashboard usage
-
Capture audit trail of user activities on dashboards
-
Tune deployment and tune extract, transform, and load (ETL) processes
-
-
Tune business operations
-
Monitor search activity
-
Identify and analyze user intents
-
Resolve issues as they arise
-
-
Track personalizations
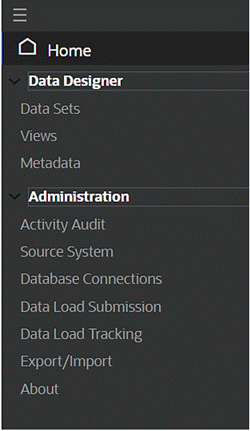
To access the dashboard, navigate to the Activity Audit section in the Administration UI.
Menu Showing Activity Audit under Administration
Tracking User Activity
Nine types of user activity are tracked, as described in the table below.
Every user action is captured as a separate record along with additional information such as:
-
Action Details: Refinements that are applied on the dashboard due to user action. Multiple values of an attribute are separated by '|'. Each filter is captured along with the corresponding data set.
-
Filters Applied: Total filters in Selected Refinements. Multiple values of an attribute separated by '|'. Each filter is included along with the corresponding data set.
-
Component Title: Title of the component where the user action has been performed.
-
Component Type: Type of component where the user action has been performed.
-
Number of Results: Total number of records in detailed insight components (Results Table and Grid) after the user action.
-
Application Name: Name of application for the dashboard.
-
Page Name: Name of dashboard.
-
Data Set Name: Name of the data set for the user action.
| User Action | Details | What is Captured |
|---|---|---|
| Access | Following actions are captured:
|
|
| Add Filter | Following actions are captured:
|
|
| Remove Filter | Following actions are captured:
|
|
| Record Search | Following actions are captured:
|
|
| Value Search | Following actions are captured:
|
|
| Like Search | Following actions are captured:
|
|
| Saved Search | Following actions are captured:
|
|
| Export | Following actions are captured:
|
|
| JS Function Call | Following actions are captured:
|
|
Enabling Activity Audit
The following properties in the EccConfig.properties file control activity auditing. This feature can be enabled during installation by setting the properties in EccConfig.properties. For more details on installation, refer to Installing Oracle Enterprise Command Center Framework, My Oracle Support Knowledge Document 2495053.1.
-
Set the property
ecc.activity.audit.isenabledto true or false for enabling or disabling the feature respectively. -
Add the data sets to the property
ecc.activity.audit.enabled.datasets = <data set 1>, <data set 2>for capturing user activities in the dashboards configured with these data sets. Each data set key must be separated by a comma (,). By default, no data set is specified.Note: If the property is not set with any data set, the feature will be enabled to all the data sets. Dashboards (and corresponding data sets) with frequent usage where user activity needs to be captured for compliance or analytical purposes should be considered for activity audit.
-
Set the property
ecc.activity.audit.ingest.limitto define the limit on the number of user actions beyond which a Data Load is triggered to refresh the dashboard data. The default limit is 100. This can be updated to adjust the frequency of data loads based on the number of dashboards, users and the average activity.
Capturing User Activity
User activity is captured if Activity Audit application is available.
On Oracle Enterprise Command Center Framework server startup, the Activity Audit data is ingested to Oracle Enterprise Command Center Framework asynchronously by following the above procedure.
Users need not submit a data load separately. If a data load is submitted, it resets the data set and once the scheduled query load is triggered, the updated data is ingested into the Activity Audit data set.
Application and Data Set Details
-
Data Set Name: Activity Audit
-
Data Set Key: activity-audit
-
Application Name: Activity Audit
-
Application Short Name: activity-audit
-
Page Name: Activity Tracker
-
Page Short Name: activity-tracker
The Activity Audit dashboard is designed to support two use cases: tracking user activity and tracking search activity.
Usage Tab
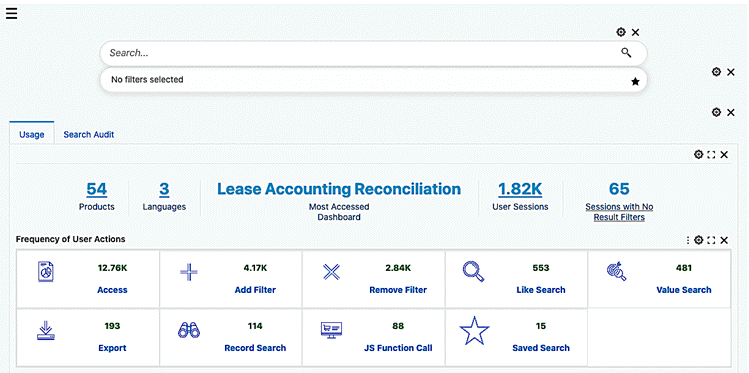
Use this tab to derive insights on holistic usage of command centers across users and their sessions, corresponding actions to identify usage that requires attention, or any exceptions usage.
Use this section of the dashboard to:
-
Review the overall usefulness of command centers by tracking a variety of user interaction.
-
Track actual usage across a timeline and assess changes in the pattern.
-
Understand if the right users are regularly interacting with the dashboards as expected.
-
Track every interaction steps of a user in any session.
Usage Tab Example - Usage Summary and Frequency of User Actions
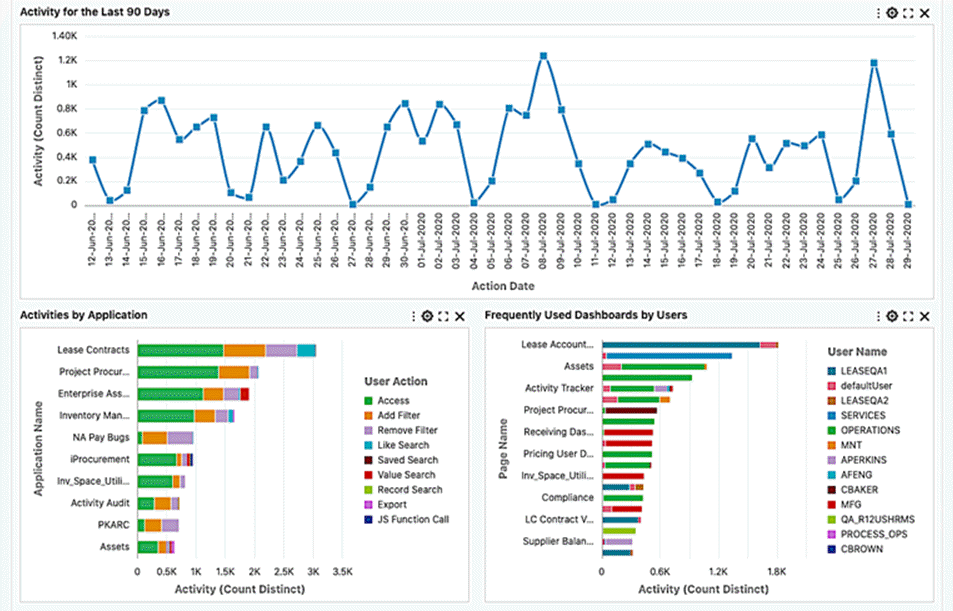
Usage Tab Example - Activity Charts
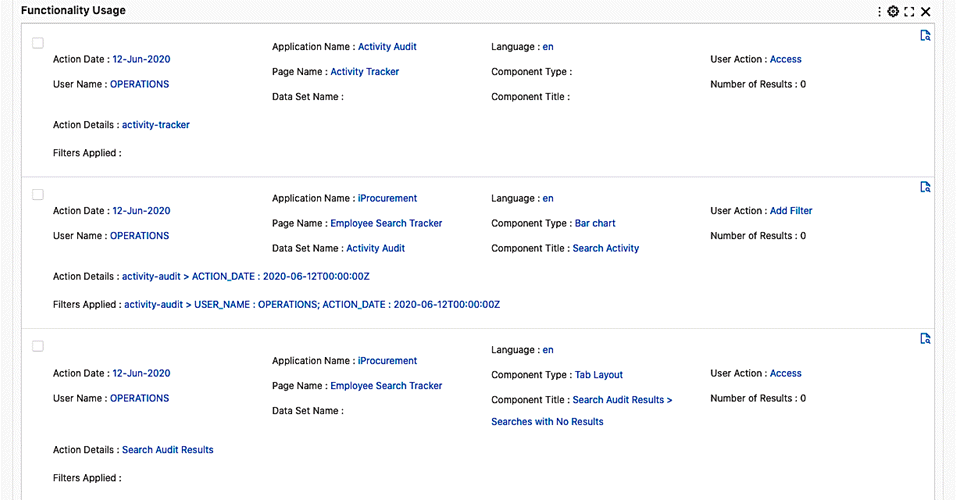
Usage Tab - Functionality Usage
| Component | Description |
|---|---|
| Usage (summary bar) | The summary bar displays overall usage metrics.
|
| Frequency of User Actions (Aggregated Grid) | The aggregated grid displays the different user action types organized by their frequency. |
| Activity for the Last 90 Days (Line Chart) | The chart is a symbolic representation of user activity for a rolling window of the previous 90 days. The chart can be used to display a trend of unique sessions for a rolling window of 90 days. |
| Activities by Application (Stacked Bar Chart) | The chart is an indicative representation of purposefulness of a dashboard by showing the division of user action types by each product. |
| Frequently Used Dashboards by Users (Stacked Bar Chart) | The chart shows the top twenty dashboards with the division of users by their usage. |
| Functionality Usage (Grid) | The grid shows record level detail of user interactions on the dashboards along with action details (filters) and cumulative filters applied. |
| Functionality Usage (Record Details) | Record details display an additional level of details for the corresponding record. Additional details include: Security filters, Conditions and actual JSON strings of Action Details and Filters Applied. |
Search Audit Tab
Use this tab to tune business operations based on user search activity. You can track user searches across dashboards to analyze user intents and identify any potential issues.
Use this section of the dashboard to:
-
Review the trend of total searches and unique searches in a timeline.
-
Focus on user search queries that yielded no results.
-
Identify dashboards, languages, search types contributing to larger share for no result search queries.
-
Understand common queries and full filter structure for identifying the root cause.
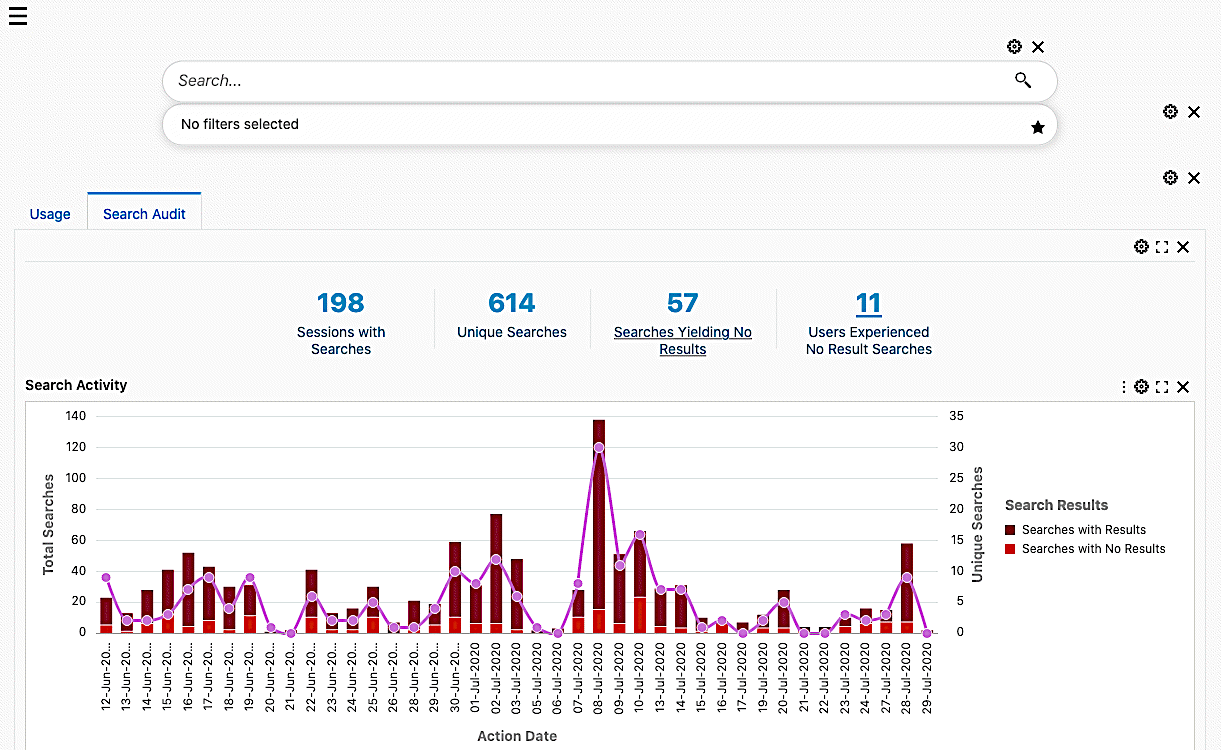
Example of Search Audit Tab - Summary and Search Activity Chart
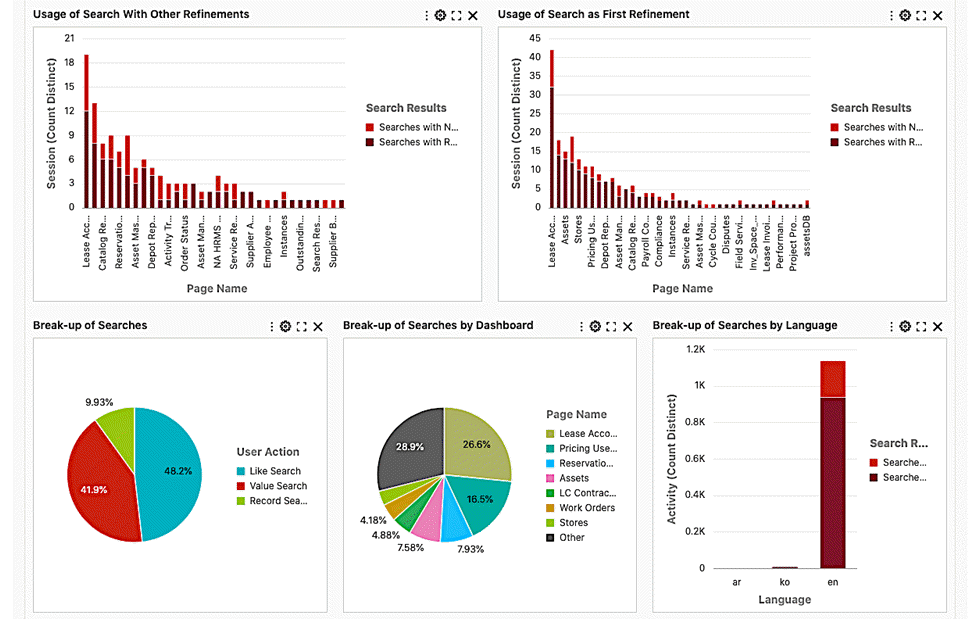
Example of Search Audit Tab - Charts Based on Refinements and Break-up of Searches
Example of Search Audit Tab - Tag Cloud for Frequent Searches

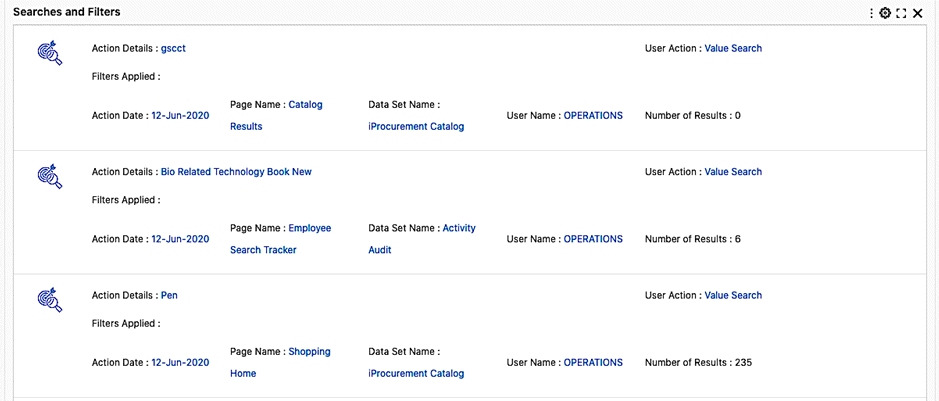
Example of Search Audit Tab - Functionality Usage
| Component | Description |
|---|---|
| Search Audit (summary bar) | The summary bar displays overall search usage metrics:
|
| Search Activity (Bar/Line Chart) | The chart shows the number of searches and unique searches over a timeline. Number of searches are shown divided into searches that yielded any results and those that did not yield any results. |
| Usage of Search with Other Refinements (Bar Chart) | The chart shows the number of searches made after applying a filter by dashboards. |
| Usage of Search as First Refinement (Bar Chart) | The chart shows the number of searches applied as the first refinement by dashboards. |
| The Break-up of Searches (Pie Chart) | The chart shows the division of total searches by search types. |
| The Break-up of Searches by Dashboard (Pie Chart) | The chart shows the division of total searches by dashboard. |
| The Break-up of Searches by Language (Stacked Bar Chart) | The chart shows searches separated by language and users. |
| Frequent Searches (Tag Cloud) | The tag cloud shows frequent search queries by users. |
| Searches and Filters (Grid) | The grid shows record-level details of user searches and resulting Filters Applied. |
Personalization Tracking Tab
Use this tab to track or revert personalization by power users.
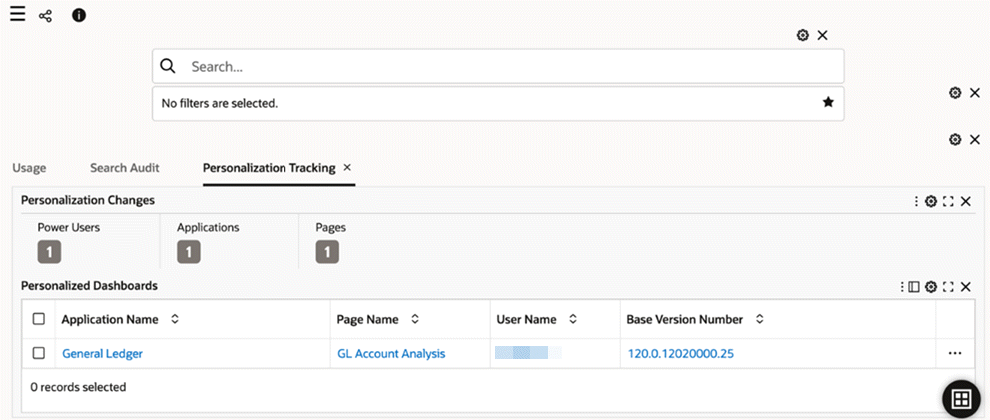
Example of Personalization Tracking Tab
| Component | Description |
|---|---|
| Personalization Changes (summary bar) | The summary bar displays overall personalization metrics:
|
| Personalized Dashboards (Results Table) | The table shows the details about personalization:
|