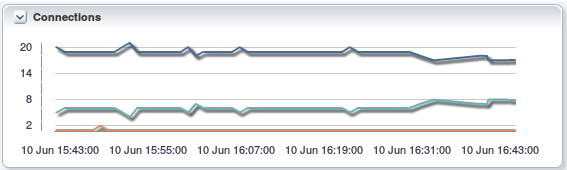
The Connections region displays the number of connections (y-axis) over time (x-axis).
The graphs are broken down into the following:
Cached connections.
Current connections.
Running connections.
If you hover the cursor over one of the lines, a tooltip displays details of the connection type.