- From the main menu, choose Run > Debug As, and then select the server.
- From the Project Explorer, right-click the project or page and choose Debug As, and then select the server.
Like any debugging task, debugging the web application's interaction with Oracle Application Development Framework (Oracle ADF) is a process of isolating specific contributing factors.
To identify and fix application problems, the ADF Debugger provides declarative breakpoints that you can set at the ADF object level (such as task flows and ADF lifecycle phases), as well as standard Java breakpoints. ADF declarative breakpoints provide a high-level object view for debugging ADF applications. For example, you can break before a task flow activity to see what parameters would be passed to the task flow. To perform the same function using only Java breakpoints would require you to know which class or method to place the breakpoint in. ADF declarative breakpoints should be the first choice for ADF applications.
For more information about debugging an ADF application, see the Using the ADF Declarative Debugger section of the Oracle Fusion Middleware Fusion Developer's Guide for Oracle Application Development Framework.
If you have valid Oracle ADF support, you can obtain complete source code for Oracle ADF by opening a service request with Oracle Worldwide Support. You can request a specific version of the Oracle ADF source code. You may be given download and password information to decrypt the source code ZIP file. Contact Oracle Worldwide Support for more information.
Adding Oracle ADF source code access to your application debugging session will:
After you have received or downloaded the "outer" ZIP, unzip it with the provided password to access the actual source code ZIP file. The ADF source code ZIP name should be a variant of the ADF version number and build number. For example, the ADF source ZIP may have a format similar to adf_vvvv_nnnn_source.zip, where vvvv is the version number and nnnn is the build number. Extract the zip into a folder that has the same name as the zip. For example, if the ADF zip is named adf_111150_6013_source, extract it into a folder called adf_111150_6013_source.
To add an ADF source library to a project:
Note: When multiple versions of WLS (for example, 10.3.5 and 10.3.6) and ADF runtime are configured in OEPE, and the shared libraries from these distributions have the same sub-version, only the latest WAR/JAR from the latest WLS runtime will be registered in the OEPE shared library registry. If the version of ADF source code (for example, 11.1.1.6.0) provided to OEPE is targeted to an older WLS/ADF runtime, it will not be mapped to the later version of the runtime JAR.
You use the ADF Declarative Debugger features in OEPE to declaratively set breakpoints on ADF task flow activities, ADF bindings, and ADF lifecycle phases. ADF declarative breakpoints provide a high-level object view for debugging ADF applications. For example, you can break before a task flow activity to see what parameters would be passed to the task flow. To perform the same function using only Java breakpoints would require you to know which class or method to place the breakpoint in. ADF declarative breakpoints should be the first choice for ADF applications.
The ADF Declarative Debugger also supports standard Java code breakpoints. You can set Java code breakpoints in any ADF application. You may be able to use Java code breakpoints when an ADF declarative breakpoint does not break in the place you want.
The ADF Declarative Debugger is built on top of the Java debugger, so it has the features and behaviors of the Java debugger. But instead of needing to know the Java class or method, you can set ADF declarative breakpoints in visual editors.
You can add breakpoints to task flow activities in the task flow editor by selecting a task flow activity and using the context menu to toggle or disable breakpoints on that activity. After the application pauses at the breakpoint, you can view the runtime structure of the objects as well as a list of data for a selected object in the ADF Structure and Data window.
When an ADF declarative breakpoint is set, it appears as a red dot icon in the task flow activity.
To set and use a breakpoint on a task flow activity:
A blue dot appears on the task flow activity, signifying that the breakpoint has been set.
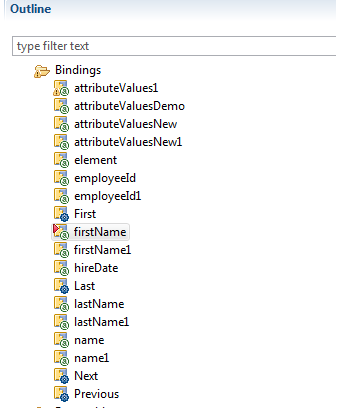
adfc-config.xml, faces-config.xml, task flow, or page and choose Debug As, and then select the server.You can add breakpoints to page definition executables and bindings in the page definition editor by selecting a binding or executable item and using the context menu to toggle or disable 'before' or 'after' breakpoints on that item. After the application pauses at the breakpoint, you can view the runtime structure of the objects as well as a list of data for a selected object in the ADF Structure and Data window.
To set and use ADF page definition breakpoints:
You can set Before and After breakpoints on all the ADF lifecycle phases in the ADF Lifecycle diagram. For each phase, you can set Before only, After only, or both. You can set breakpoints on as many phases as you want. The ADF Lifecycle diagram is available from the Breakpoints window. You can set ADF lifecycle breakpoints on any of the ADF lifecycle phases:
To set and use ADF lifecycle phase breakpoints:
The ADF Lifecycle Diagram is displayed.
When the application is paused at a breakpoint, you can use the EL expression evaluator to enter an EL expression for evaluation. You can enter arbitrary EL expressions for evaluation within the current context. If the EL expression no longer applies within the current context, the value will be evaluated to null. The EL Evaluator is available for debugging any JSF application.
To use the EL Evaluator:
When you click in the field after entering #{ or after a period, a discovery function provides a selectable list of expression items. Auto-completion will be provided for easy entry. You can evaluate several EL expressions at the same time by separating them with semicolons.
The ADF Structure and Data window displays the ADF structure on the left pane, and relevant data for a given object in the right pane.
When you use the Debug perspective of OEPE, the ADF Structure and Data window opens by default. To manually launch the ADF Structure and Data window, choose Window from the main menu, and then select Show View > ADF Structure and Data.
When the application is paused at a breakpoint, the ADF Structure pane displays a tree structure of the ADF runtime objects and their relationships within the application. In particular, it shows the hierarchy of view ports, which represent either the main browser window or contained regions. When you select different items in the ADF Structure pane, the data display in the accompanying ADF Data pane changes.
The roots of the hierarchy are the sibling nodes Scopes and ADF Context.
When an application is paused at an ADF declarative breakpoint, the ADF Data pane (in the ADF Structure and Data window)s displays relevant data based on the selection in the ADF Structure pane.
The ADF Data pane displays the following types of data: