3 Using Discoverer Plus with a multidimensional data source
This chapter introduces Discoverer Plus OLAP and contains the following topics:
-
"How can I tell when I am using Discoverer Plus with a multidimensional data source?"
-
"About applying filters after aggregating multidimensional data"
3.1 How can I tell when I am using Discoverer Plus with a multidimensional data source?
When you are using Discoverer Plus with a multidimensional data source, the Connect to property of the connection that you choose to start Discoverer Plus is set to Oracle BI Discoverer for OLAP.
If you start Discoverer Plus with a multidimensional data source by entering login details directly in Discoverer Connections page, you must select Oracle BI Discoverer for OLAP from the Connect To drop down list.
3.2 What is Discoverer Plus OLAP?
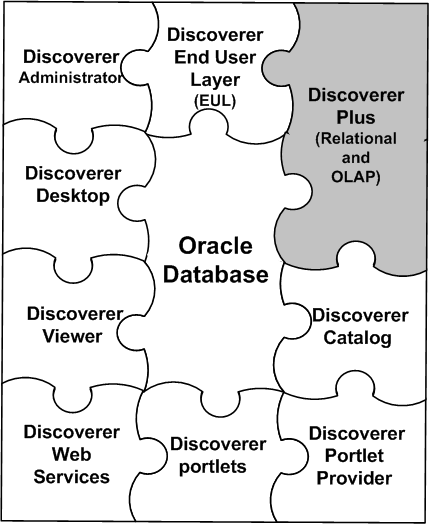
Discoverer Plus OLAP enables you to access and analyze multidimensional data from the database of your company, without having to understand complex database concepts. Using wizards and menus, Discoverer Plus OLAP guides you through the steps to retrieve and analyze data that supports your business decisions.
Figure 3-1 Oracle BI Discoverer components
Description of "Figure 3-1 Oracle BI Discoverer components"
Note: Discoverer Plus OLAP is supplied with sample workbooks stored in the Discoverer Catalog that you can use to familiarize yourself with Discoverer. For more information about accessing the sample workbooks, contact the Discoverer manager.
3.3 What is online analytic processing (OLAP)?
Online analytic processing (OLAP) describes queries that are run against a multidimensional data source. While a simple query might ask, "When did order 84305 ship?", a typical series of OLAP queries might ask, "How do sales in the Southwestern region for this quarter compare with sales a year ago? What can we predict for sales next quarter? What factors can we alter to improve the sales forecast?".
Most standard queries involve simple data selection and retrieval. However, OLAP queries are more structured and involve calculations, time series analysis, and quick access to aggregated historical and current data. In OLAP queries, you know the dimensions and hierarchies that measures use. You query the data in business terms, such as "How are my products selling in my regions?" Each dimension has its own selection that mirrors the way that you ask questions.
3.4 What are multidimensional data sources?
A multidimensional data source is optimized for analyzing large amounts of data. Such data sources are sometimes called data warehouses, or online analytical processing (OLAP) data sources.
In a relational data source, data is organized in tables. A table is a data structure with columns and rows. Multidimensional data is data that is organized by one or more dimensions. These multidimensional data structures are often referred to as cubes. Figure 3-2 depicts the tables in a relational data source and the cubes in a multidimensional data source. Oracle9i (and later) databases can include both relational data structures (tables and columns) and multidimensional data structures (cubes). This combination provides fast multidimensional data access while providing summaries of the relational data.
Figure 3-2 Tables and cubes in the Oracle database
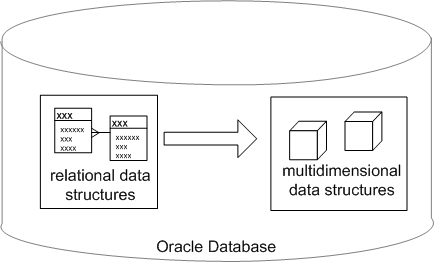
Description of "Figure 3-2 Tables and cubes in the Oracle database"
For information on relational data sources, see "What is a relational data source?".
3.5 What are multidimensional cubes?
A cube in a multidimensional data source has the following components:
-
A measure, which is the name given to the data itself; that is, to the data that you track such as sales figures or cost numbers.
-
One or more dimensions. Dimension is the name given to the parts of the cube that categorize the data, such as Product, Geography, and Time. Dimensions have dimension members, dimension hierarchies, and attributes.
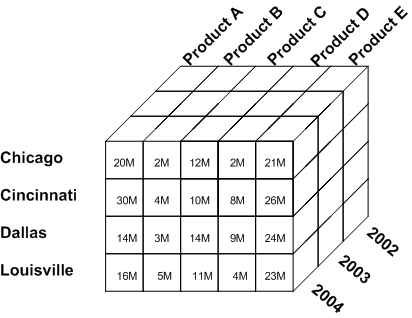
For example, Figure 3-3 shows a cube that contains sales figures for different products in different years and in different cities:
-
The sales figures are the data in the cells of the cube. Sales is the measure for this cube.
-
The parts of the cube that categorize the data are Product, Time, and City. Product, Time, and City are the dimensions of this cube.
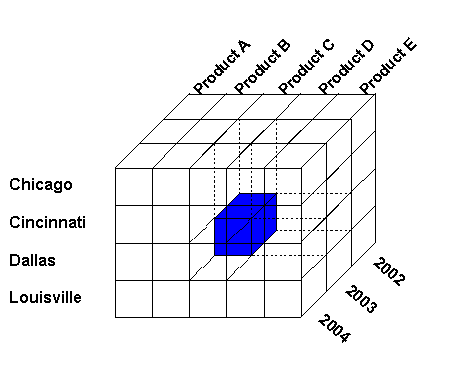
The cube contains a measure value for each possible combination of the different dimensions. It is therefore very quick for applications such as Discoverer Plus OLAP to find the value for sales of a particular product in a particular city in a particular year. For example, to find sales of Product C in 2003 in Dallas, Discoverer Plus OLAP simply uses the Product, Time, and City dimensions to identify the cell that contains the required value, as shown in Figure 3-4.
3.6 What are measures?
In OLAP metadata, measures represent data that can be examined and analyzed in crosstabs and graphs. Examples include Sales, Cost, and Profit.
Figure 3-5 shows a crosstab in Discoverer Plus OLAP that is displaying data from the Sales measure. Above the crosstab are the page items that allow you to select which page of data to display.
Figure 3-5 Crosstab that is displaying the Sales measure
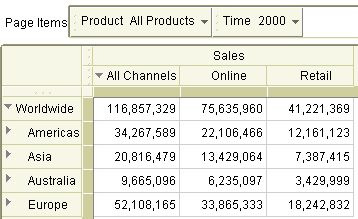
Description of "Figure 3-5 Crosstab that is displaying the Sales measure"
3.7 What are dimensions and dimension members?
Measures have dimensions that categorize the data in the measure. For example, a Sales measure might have Product, Time, and Geography as its dimensions. When a measure has a particular dimension, the measure is said to be dimensioned by that dimension. For example, Sales is dimensioned by Product. The group of dimensions for a measure constitute the dimensionality of that measure. For example, the dimensionality of Sales is Product, Time, and Geography.
Each element in a dimension is a dimension member. For example, January 2001, February 2001, March 2001, Quarter 1 2001, and the year 2001 are likely members of the Time dimension.
Measures can be dimensioned by more than three dimensions. In this document, we use a three-dimensional cube to present a virtual and easy-to-understand representation of multidimensional data.
3.8 What are dimension hierarchies?
A dimension hierarchy describes a hierarchical relationship among two or more dimension members.
Individual dimension members might be related to each other in a hierarchical way. For example, a specific day belongs to a particular month, which in turn is within a particular year. To reflect such relationships, dimension members are organized into dimension hierarchies. Hierarchies allow you to drill deeper into the data, to view more detailed information.
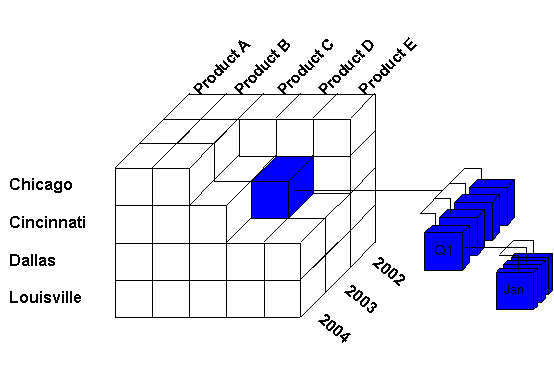
A dimension hierarchy can use ordered levels to organize and aggregate data. For example, the Time dimension might have a hierarchy to aggregate data from the Month level to the Quarter level to the Year level. Figure 3-6 presents an example of a dimension hierarchy for the Time dimension, which shows how data is ordered by Month, Quarter, and Year. The cell that is highlighted in the cube represents sales of Product D in Cincinnati in 2003. Along the Time dimension, that cell can be broken out into quarters, and each quarter can be broken out further into months.
Figure 3-7 presents another view of the hierarchy for the Time dimension. Data for the year 2003 can be broken into four quarters, and each quarter can be broken into three months.
Figure 3-7 Alternative view of a time hierarchy

Description of "Figure 3-7 Alternative view of a time hierarchy"
A dimension can have multiple hierarchies. For example, a Time dimension might have different hierarchies if a company has a Fiscal year that does not correspond to a Calendar year. One hierarchy might be Calendar Year->Calendar Quarter->Month while another is Fiscal Year->Fiscal Quarter->Month. Where several dimension hierarchies exist for the same dimension, one dimension hierarchy must be specified as the default hierarchy.
3.9 What are dimension attributes?
A dimension attribute describes a characteristic that is shared by dimension members. Dimension attributes enable you to select data based on similar characteristics. For example, a Product dimension might have a Color attribute that enables you to search for all red products.
3.10 About aggregating and filtering multidimensional data
This section describes aggregation and filtering in Discoverer Plus OLAP.
3.11 About applying filters after aggregating multidimensional data
When you ask common business questions, you often filter values; that is, you try to find dimension values that meet certain conditions. For example, you may want to look at regions where Sales are greater than $2 billion. You likely want to examine values that contribute to the success of these regions.
With multidimensional data, the different levels in a hierarchy contain aggregations of the data at lower levels. The aggregation of data values happens first, then you filter those values. Thus, values for aggregate data are not dependent on the filter. For example, suppose you create a query in which you are displaying Total Company and region values where Sales are greater than $2 billion and Quota Variance is greater than 7%, as shown in "Example of applying filters after aggregating".
Table 3-1 Example of applying filters after aggregating
| Regions | Sales Dollars | Quota Variance |
|---|---|---|
|
- Company A |
$10 billion (immutable) |
10% |
|
+ Northeast |
$3.5 billion |
8% |
|
+ Southwest |
$2.2 billion |
12% |
The value for Company A's Sales would not change when underlying dimension values have been filtered. So in our example, Company A's Sales remain $10 billion even though only the regions who Sales are greater than $2 billion are displayed in the query.
An aggregate value would meet the filter condition even if not all of its children do, which enables you to drill into underlying issues. For example, consider our example above in which Quota Variance is greater than 7% for Company A and for the Northeast and Southwest regions. When you drill into the Southwest region, you discover that the Quota Variance for the state of Arizona is -50%; a pressing problem that needs attention.
Aggregate values and their children are often at different scales. For example, a region might be 100 times bigger than any one of its children.
3.12 About filters and dimensions
Filters apply to dimensions. Each dimension has an associated query. The data selected by a dimension's query might or might not be dependent on the data selected by another dimension's query. Consider the following example:
-
Time dimension: Select latest 6 months
-
Geography: Select territories where Sales is greater than Quota.
-
Product: For each territory, select categories where Sales growth is negative.
For clarity, a filter must be fully qualified. For example, suppose you create a query in which you want to display the top three selling products for each Geography, and Time is set to January. If you change the value of Time to February, then you change the result of the query; that is, the top three selling products might be different for February.
3.13 What is the Discoverer Catalog?
The Discoverer Catalog is a repository for storing and retrieving definitions of objects for Discoverer Plus OLAP and can be used by applications that are built with Oracle Business Intelligence Beans (BI Beans). With Discoverer Plus OLAP, you use the Catalog to store objects such as workbooks, calculations, and saved selections and to share objects with others who have access to the Catalog. For example, you can use a BI Beans application to create a graph and store it in the Catalog. If another user has appropriate access, that user can retrieve the graph that you stored in the Catalog and insert the graph into a new worksheet in Discoverer Plus OLAP.
The Catalog provides security at the object level, by allowing users and system administrators to specify access to certain objects.
3.14 About the Discoverer Plus OLAP Tutorial
For a hands-on introduction to using Discoverer Plus OLAP, see the Discoverer Plus OLAP Tutorial. The tutorial guides you through the creation of a sample workbook, which displays data about a fictitious company.
You can access the Discoverer Plus OLAP Tutorial and other information about Discoverer (such as white papers and best practices) from Oracle Technology Network at www.oracle.com/technology.
3.15 Where can I find out more about Discoverer Plus OLAP?
To find out more about Discoverer Plus OLAP, use:
-
the Discoverer Plus OLAP help system
Click the Help button or press F1 in any Discoverer Plus OLAP dialog to display context sensitive help, or choose Help | Help Topics to see a list of the topics in the help system.
To find a topic in the help system:
-
use the Contents tab to see a structured list of the topics in the help system
-
use the Index tab to search the help system using pre-defined keywords and phrases
-
use the Search tab to search the help system for keywords and phrase s that you define
-
-
the Discoverer Plus OLAP Tutorial
Use the Discoverer Plus OLAP tutorial to begin learning about Discoverer Plus OLAP. For more information, see "About the Discoverer Plus OLAP Tutorial".
-
Oracle Technology Network
Other information about Discoverer Plus OLAP (for example, white papers, best practices) is available from Oracle Technology Network at www.oracle.com/technology.
