A script enabled browser is required for this page to function properly.
Skip to main content
STA User Interface Guide, v1.0.2
E28380-03
Table of Contents Previous Next Index


Filtering Table Data : Applying a Filter : Filtering Using Dashboard Graphics

Filtering Using Dashboard Graphics

Bar charts and pie charts on the Dashboard display aggregate data for resources or events that meet specific criteria. A filter is therefore intrinsic to each section of a Dashboard bar chart or pie chart.

For example, in the following “Health by Media Type” graph, the selected section of the LTO‑4 bar represents 34 drives with a health status of “Monitor”.

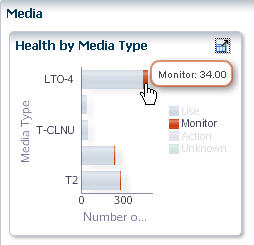
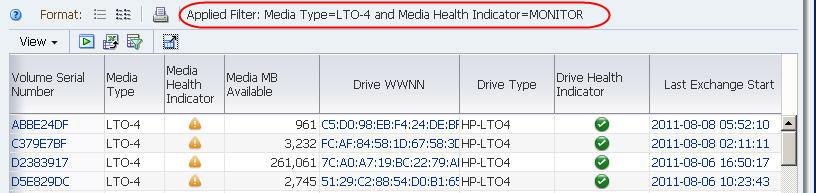
Clicking this section of the bar takes you to the Media – Overview screen and applies the intrinsic filter. The filter criteria are indicated in the Applied Filter area of the table.


Table of Contents Previous Next Index Link to documentation
Copyright © 2012 Oracle and/or its affiliates. All rights reserved.