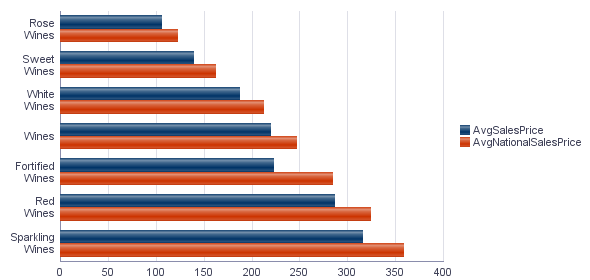
Here is an example of a horizontal bar chart.
The LQL query for this example uses a single
GROUP BY statement with two metrics:
RETURN NumCases AS SELECT
    AVG(Unit_Sale_PriceDollars) AS AvgSalesPrice,
    AVG(Product_Avg_National_Sales_PriceDollars) AS AvgNationalSalesPrice
GROUP BY Varietals ORDER BY AvgNationalSalesPrice
The chart compares the "AvgSalesPrice" metric to the "AvgNationalSalesPrice" for each varietal: