The Performance Metrics component on the Control Panel displays information about component and MDEX Engine query performance.
It uses the same logging data recorded in LatitudeStudio-metrics.log.
However, unlike the log file, the Performance Metrics component uses data stored in memory. Restarting Latitude Studio clears the Performance Metrics data.
For each type of included metric, the table at the top of the component contains a collapsible section.
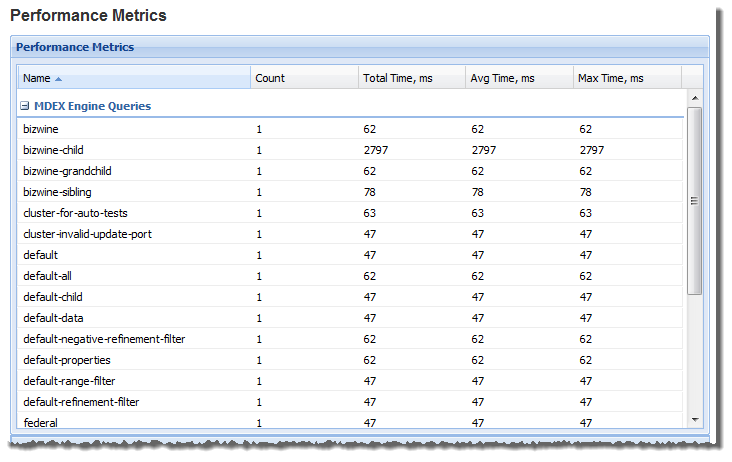
For each data source or component, the table tracks:
- Total number of queries or executions
- Total execution time
- Average execution time
- Maximum execution time
For each type of included metric, there is also a pie chart summarizing the average query or execution time per data source or component.
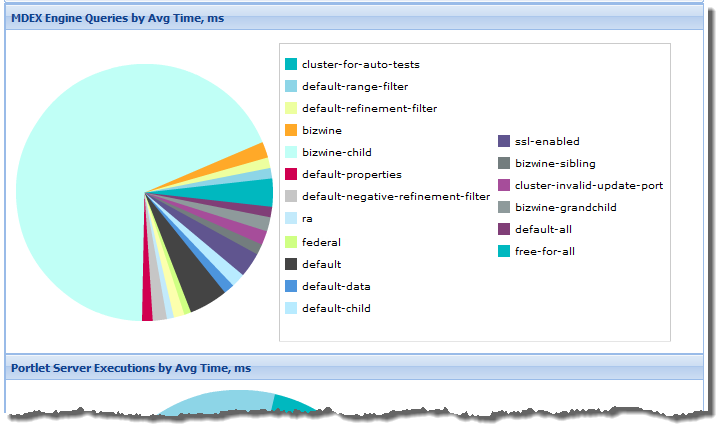
Note: MDEX Engine query performance does not correlate directly to a
page, as a single page often uses multiple MDEX Engine queries.
