The top sections of the edit view allow power users to configure the data source and general display options for the Chart component as a whole.
To configure the data source and display options:
-
On the component edit view, to bind a different data source to the
component, select the data source from the drop-down list, then click
Update data source.
Note that the same data source is used for all of the charts created for the Chart component.
-
Under
Chart Options, set the display options for the
chart:
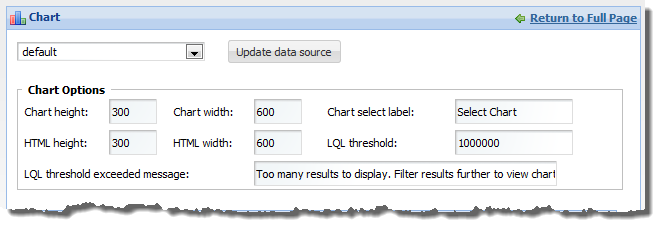
Chart height In the field, enter the display height in pixels of the chart. Chart width In the field, enter the display width in pixels of the chart. HTML height In the field, enter the height in pixels of the HTML page in which to display the chart. For the best display results, this should be the same as the chart height.
HTML width In the field, enter the width in pixels of the HTML page in which the chart will be displayed. For the best display results, this should be the same as the chart width.
Chart select label In the field, enter the label to use for the drop-down list from which end users select the chart to display. This is only used if the component contains more than one chart.
LQL threshold In the field, type the maximum number of LQL results the query can return. If the number of results is larger than this number, then the message in the LQL threshold exceeded message field is displayed.
LQL threshold exceeded message In the field, type the message to display if the number of query results exceed the value specified in the LQL threshold field.
