The Metrics Configuration section of the Cross Tab component edit view allows power users to control the layout of the table and the format of the metrics values.
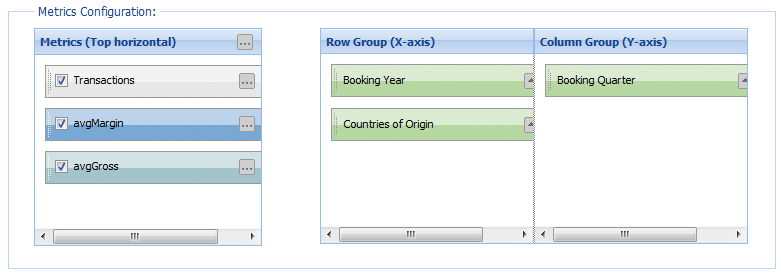
- The Metrics list contains the metrics from the LQL query. By default, the metrics labels are displayed in the bottom header row on the table.
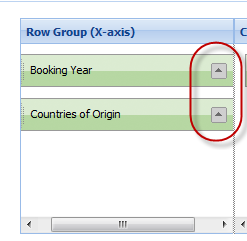
- The Row Group list contains the group by fields that are displayed as the header columns to the left of the table.
- The Column Group list contains the group by fields that are displayed as the header rows above the metrics labels.
As you make changes to the configuration, to see their effects on the table, check the preview table at the bottom of the edit view.
To configure the layout of the Cross Tab table:
-
In the
Metrics list, to configure the general display
rules for the metrics:
-
Click the
... button in the top right corner.
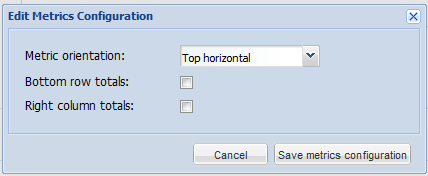
The Edit Metrics Configuration dialog is displayed.
-
From the
Metric orientation drop-down list, select
where to display the metrics labels:
- To display the metrics labels across the top of the table, select Top horizontal. This is the default value.
- To display the metrics labels to the left of the table, select Left vertical.
-
To add a row to the bottom of the table containing the totals
for each column, check the
Bottom row totals checkbox.
This box is unchecked by default.
-
To add a column to the right of the table containing the
totals for each row, check the
Right column totals check box.
This box is unchecked by default.
Note: Totals are computed using the same aggregating function as the original metric. For example, metrics computed using the average function (AVG) display an overall average for the total. Because totals may be confusing in cases where the ARB function is used, you may not want to display totals in those cases. -
Click the
... button in the top right corner.
- In the Metrics list, to determine the order in which to display the metrics, drag and drop the metrics within the list.
-
In the
Metrics list, to remove a metric from the
table, uncheck its checkbox.
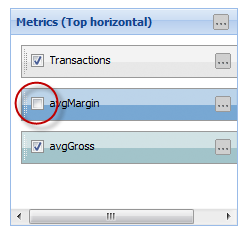
You would most likely use this option to hide a metric that you used to generate the metric you wanted to display. Otherwise, if you do not want to display a metric, you should remove it from the LQL query instead of unchecking the checkbox.
-
In the
Metrics list, to configure the display of an
individual metric:
-
Click the
... button on the metric label.
The Edit Metric Properties dialog is displayed.
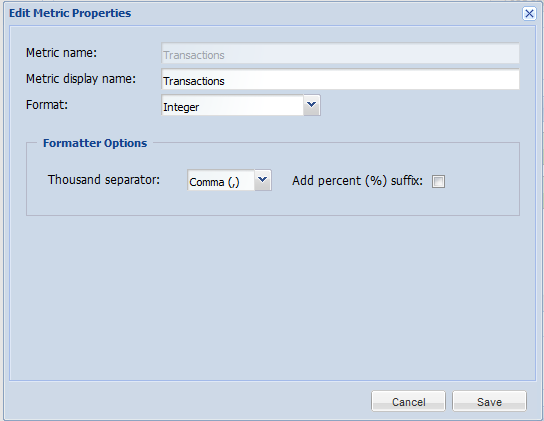
- In the Metric display name field, type the label to display for the metric row or column heading.
-
From the
Format drop-down list, select the format
to use to display the metric.
When you select the format, the Formatter Options section is updated to display the available fields for that format.
The format options are:
Integer Displays the metrics value as an integer. This is the default value.
For an integer value, you can configure:- The character to use for the thousands separator
- Whether to display a percent sign after the value
Currency Displays the metrics value as a currency value. For a currency value, you can configure:- The character to use for the thousands separator
- The character to use for the decimal point
- The number of decimal places to display
- The currency symbol to display
- Whether to display the currency symbol before the value (prefix) or after the value (suffix)
Decimal Displays the metrics value as a decimal value. For a decimal value, you can configure:- The character to use for the thousands separator
- Whether to display a percent sign after the value
- The character to use for the decimal point
- The number of decimal places to display
- To save the changes, click Save.
-
Click the
... button on the metric label.
-
In the
Row Group and
Column Group sections, to configure the group
by values:
-
To control where the group by value displays, drag it to the
appropriate list:
- To display it as a row heading, drag it to the Row Group list.
- To display it as a column heading, drag it to the Column Group list.
-
To determine the order in which the group by values display,
drag the values within the list.
In the Row Group list, the top value is in the leftmost heading column.
In the Column Group list, the top value is in the top heading row.
-
To control the order in which the values display, use the
toggle next to the value name.
By default, the values display in ascending order. To display the values in descending order, click the icon.
-
To control where the group by value displays, drag it to the
appropriate list:
