Each chart requires an LQL query to generate the values used on the chart. For a parametric chart, instead of referring to specific attributes, the query contains placeholder values, and you provide a set of available attributes.
On the chart tab of the Chart edit view, to provide the LQL query and select the metrics:
-
To create a non-parametric chart:
-
In the text area, enter the LQL query on which the chart will
be based. For example:
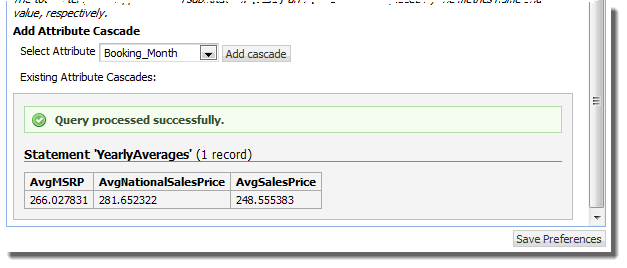
RETURN YearlyAverages AS SELECT
    AVG(Product_MSRPDollars) AS AvgMSRP,
    AVG(Product_Avg_National_Sales_PriceDollars) AS AvgNationalSalesPrice,
    AVG(Unit_Sale_PriceDollars) AS AvgSalesPrice
GROUP
Note that for non-parametric charts, the metrics labels are defined using the AS clause in the LQL query. The labels must be NCName-compliant (no spaces or special characters).
-
To test the validity of the query, click the
Test LQL query button.
If the query is not valid, then an error message is displayed.
If the query is valid, then a "success" message is displayed, as well as the metric values from the query.
-
To save the new or updated LQL query, click
Save Preferences.
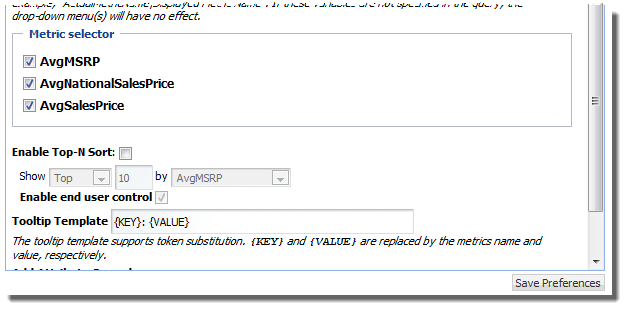
The Metric selector section is displayed, listing all of the metrics from the current LQL query.
-
By default, the chart displays all of the metrics. From the
Metric selector section, to remove a
metric from the display, uncheck its checkbox.
For example, your LQL query may include a metric to control the display order of the chart elements. However, you may not want the chart to display this value.
- To save any changes to the configuration, click Save Preferences again.
-
In the text area, enter the LQL query on which the chart will
be based. For example:
-
To create a parametric chart, where end users can use drop-down
lists to change the chart display:
-
In the LQL query, replace the attribute names with the
following placeholder values:
- {METRIC} is replaced
at runtime by a user-specified value from the
Metrics Options list.
If you use the {METRIC} token, you must use it for both the field to be returned and the "AS" alias for that field. The {METRIC} token is an exception to the rule that the metric name must be NCName-compliant.
- {XAXIS} is replaced at runtime by a user-specified value from the X Axis Options list.
- {CROSSTAB} is
replaced at runtime by a user-specified value from the
Cross tab list.
Cross tabs are grouped aggregations such as cross-tabulated totals over one or more attributes.
For example:RETURN MyChart AS SELECT AVG({METRIC}) as {METRIC} GROUP BY {XAXIS} - {METRIC} is replaced
at runtime by a user-specified value from the
Metrics Options list.
-
In the
Metric options,
X Axis options, and
Cross tab fields, enter the lists of
attributes you want to use.
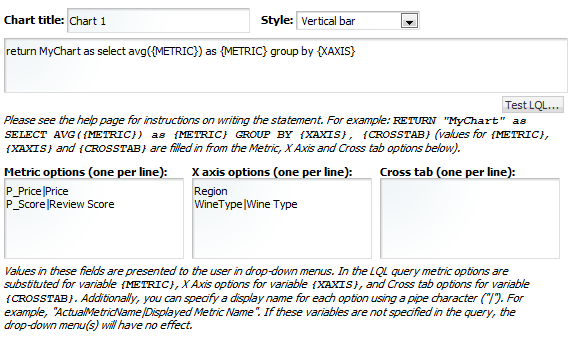
These attributes become the available options in the drop-down lists used to control the chart display.
For each attribute, you must provide the attribute key (not the display name). You also can provide a display name to use in the drop-down list on the end user view. The format is:AttributeKey|Display Name
For example:Trans_Country|Country
- To save the configuration, click Save Preferences.
-
In the LQL query, replace the attribute names with the
following placeholder values:
- To exit the edit view, click Return to Full Page.
