| Oracle® Argus Insight Cognos Administrator's Guide Release 7.0.1 E28480-01 |
|
|
PDF · Mobi · ePub |
| Oracle® Argus Insight Cognos Administrator's Guide Release 7.0.1 E28480-01 |
|
|
PDF · Mobi · ePub |
In addition to the preformatted standard reports, Argus Insight provides the Report Writer tool that you can use to create custom reports for ad hoc/special reporting requirements.
Report Writer is used to create a custom report by directly selecting data mart fields and applying filters on them. The report output can be displayed in various layouts and can be saved in file formats, such as PDF, XLS, or CSV.
This chapter, which explains how to use the custom report tools, includes the following topics:
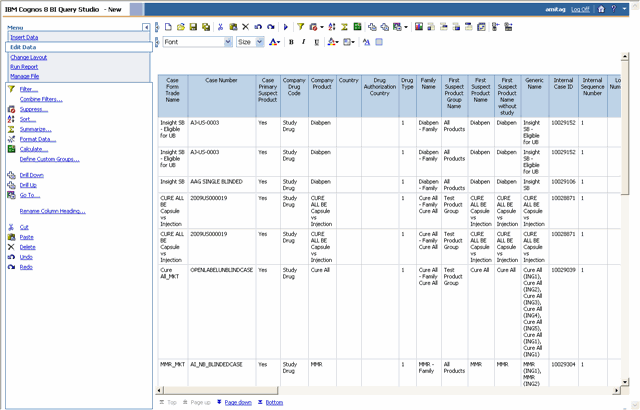
In this version of Argus Insight, Report Writer uses the features of Cognos 8 Query Studio to let you create custom reports by directly selecting data mart fields and viewing the results (report output) on the fly. The Report Writer interface provides a list of database fields organized in a tree structure. To create a report, expand the trees corresponding to the required database fields and select the fields to be displayed as columns in your report.
Once you have created your report, you can edit the report, change the report layout, run the report in specific formats, and save the report.
Note:
The report author must ensure to not use those enterprise-specific values in the report, which will also be shared with other enterprises.To start Report Writer and create a new report:
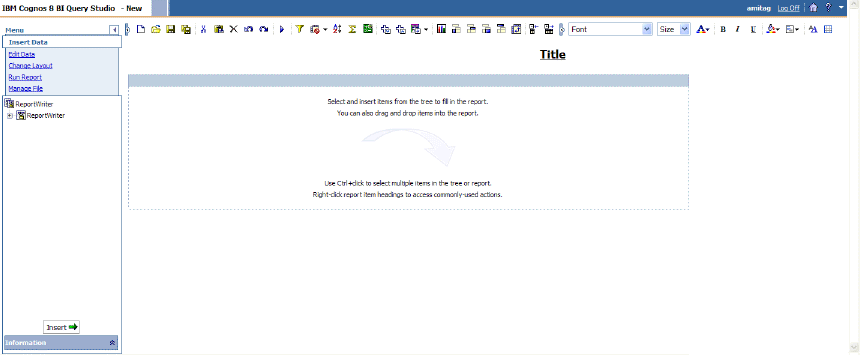
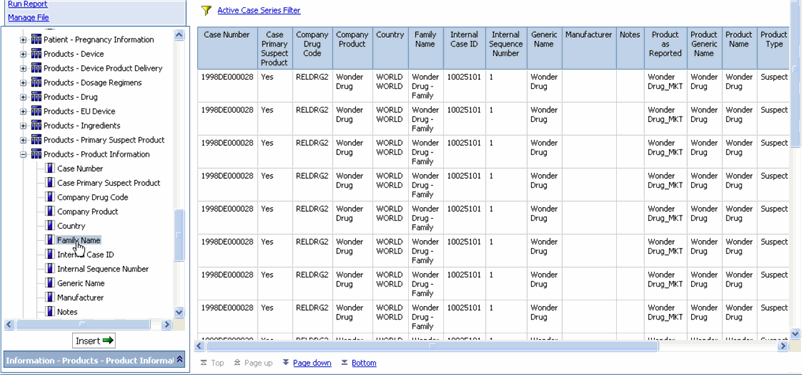
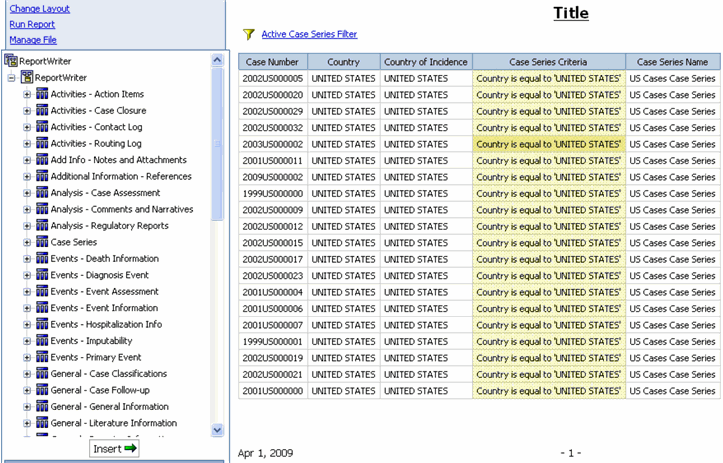
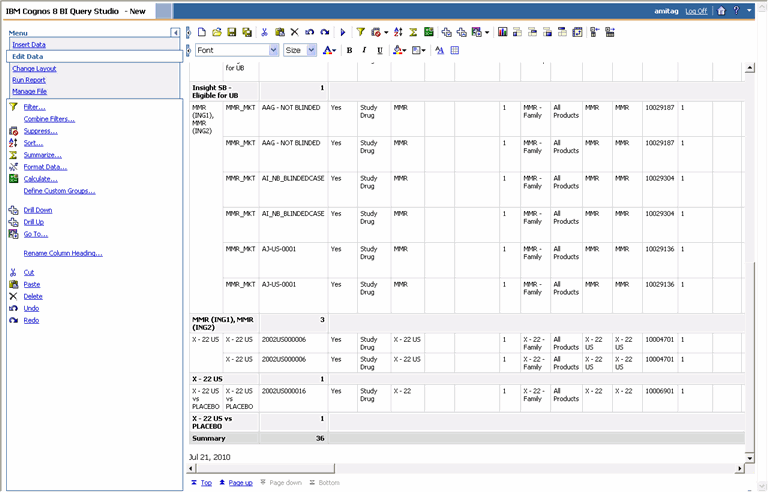
Navigate to Case Series Reports, Report Writer, and select New. Query Analysis starts. In the left frame, the Insert Data menu option is selected.
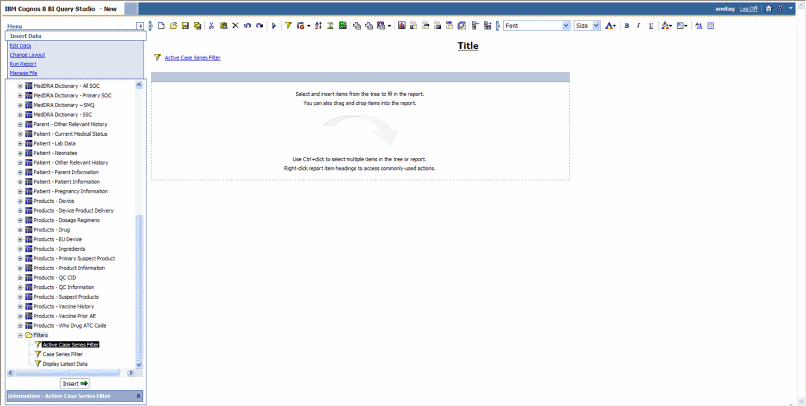
Select Active Case Series Filter.
Note:
Select the active case series filter before selecting data mart fields for your report. This prevents Report Writer from querying the entire data mart and slowing down the report output generation.To view the active case series, navigate to Query Results, Case Series, and select Active in Argus Insight.
To make a different case series active, navigate to Query Results, Case Series, and select Library in Argus Insight. When the CASE SERIES LIBRARY page opens, select the case series you want to make active and click Make Active.
Expand the Report Writer control tree. The various data mart views are displayed.
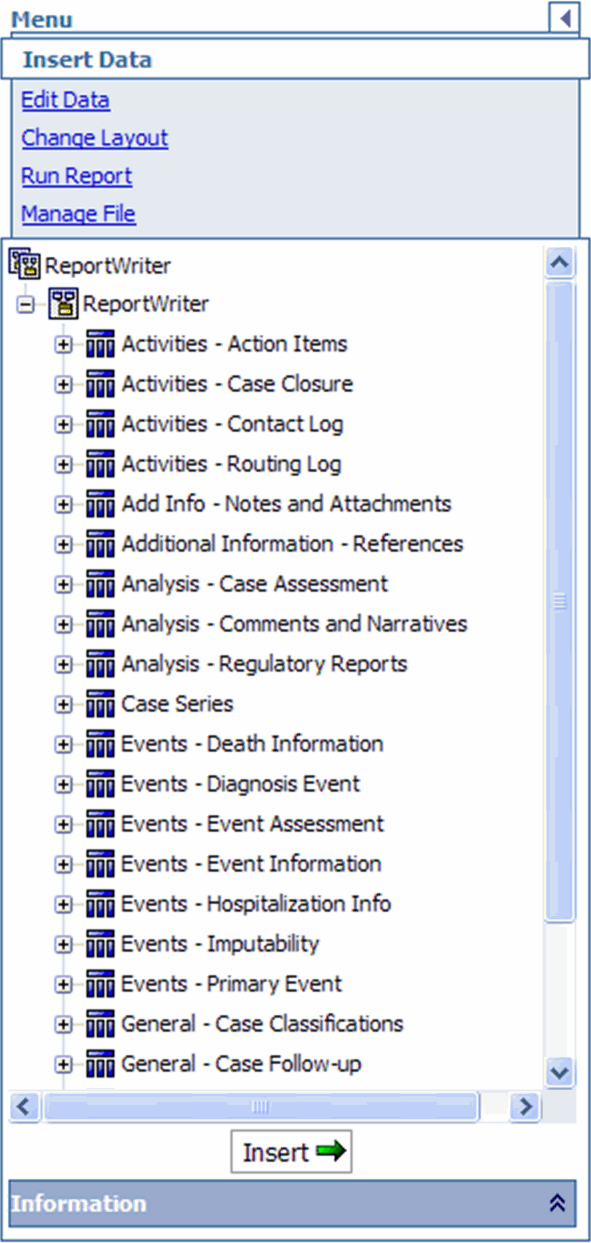
Scroll the list of views until the Filters folder is visible.
Expand the Filters folder. The built-in active case series filter is displayed.
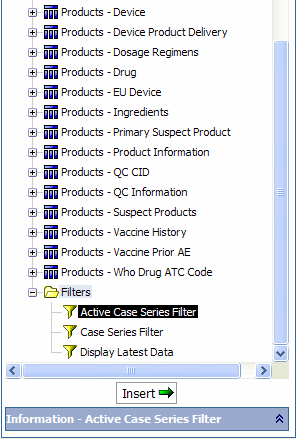
Select Active Case Series Filter.
Click Insert. The system displays the selected filter in the right frame.
Select the data mart fields to include in your report.
Expand the Report Writer control tree. The various data mart views are displayed.
Expand the data mart view tree, as appropriate. The data mart fields corresponding to the tree are displayed.
Select the data mart fields, as appropriate.
Tip:
If your report consists of fields from the Event and Product tables, it will only display data for those cases where event assessment has been done. This is because event assessment is the only way of defining relationship between an event and a product.Click Insert. The Report Writer queries the data mart, automatically executes the query for every field you selected, and displays the data for the selected fields in the report output area within the right frame. The fields you selected are displayed as columns in the report output.
Tip:
Select multiple fields as follows:Hold down the CTRL key and select the fields.
Insert an entire data mart view in your report by selecting the data mart view entity in the left frame and clicking Insert.
Drag the field entities to the report output area.
Repeat the previous steps to insert additional fields into the report.
Tip:
If you want to delete a column from the report output, select the column and click Delete on the toolbar.To revert or repeat any actions you perform in Query Studio, use the Undo or Redo options on the toolbar, respectively.
Enter the report title.
Click Title above the report output. The Edit Title section appears below the report output in the right frame.
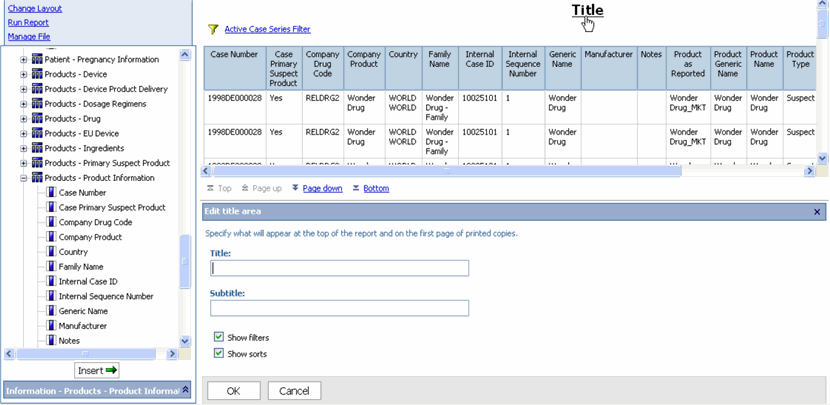
Enter the report title and subtitle in the respective fields.
Click OK. The page refreshes; the titles you entered appear above the report output.
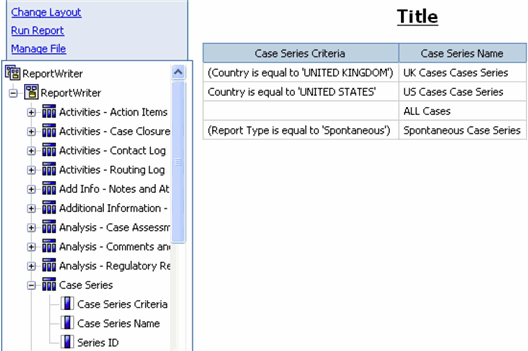
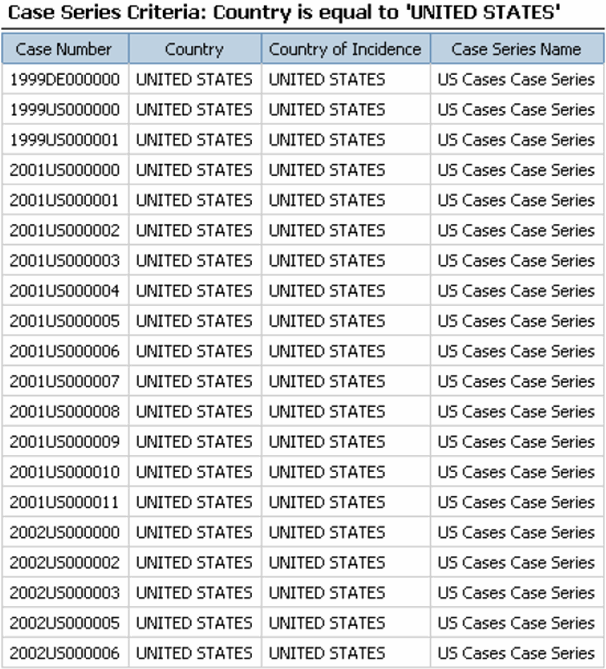
To generate a report for displaying all the Case Series Criteria and Case Series Name, select the Case Series Criteria and Case Series Name objects from the Case Series class.
The Report Writer queries the data mart to get all the Case Series Criteria and Case Series Name.
Note:
Temporary Case Series Criteria and Case Series names will not be displayed.To use the Case Series Criteria and Case Series Name with other objects:
Expand the class folders under Report Writer. The dimensions for the class category are displayed.
Scroll the list of views until the Filters folder is visible.
Expand the Filters folder.
Select Active Case Series Filter.
Click Insert. The system displays the selected filter in the right frame.
Expand the Report Writer control tree. The various data mart views are displayed.
Expand the data mart view tree, as appropriate.
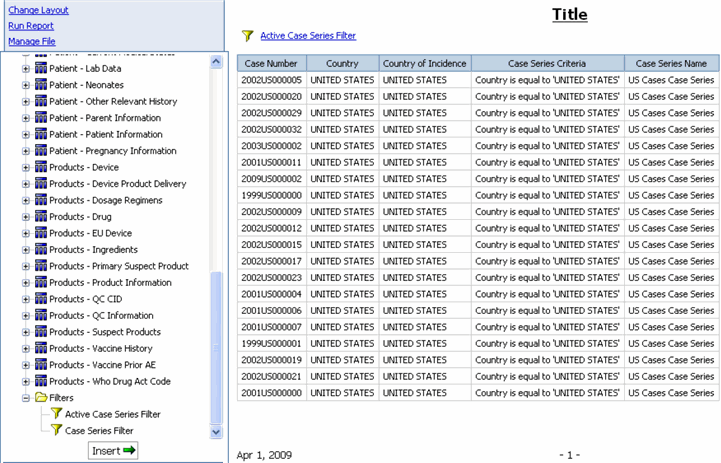
Select the data mart fields, as appropriate along with Case Series Criteria and Case Series Name from Case Series class.
Tip:
If your report consists of fields from the Event and Product tables, it will only display data for those cases where event assessment has been done. This is because event assessment is the only way of defining relationship between an event and a product.Click Insert.
The Report Writer queries the data mart, automatically executes the query for every field you selected, and displays the data for the selected fields in the report output area within the right frame. The fields you selected are displayed as columns in the report output along with Case Series Criteria and Case Series Name.
Tip:
To select multiple fields, hold down the CTRL key and select the fields. To insert an entire data mart view in your report, select the data mart view entity in the left frame and click Insert.You can also drag the field entities to the report output area.
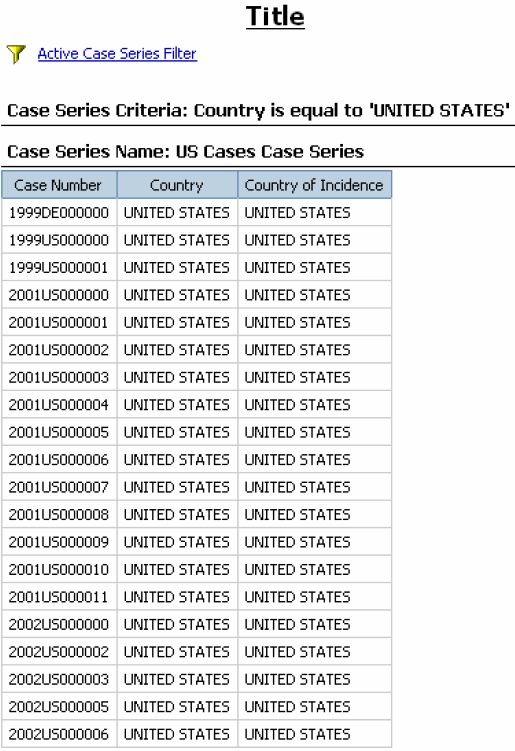
Select Case Series Criteria and click Create Sections icon.
The Case Series Criteria displays as header.
Display the Case Series Name as header.
Note:
Always use Active Case Series Filter while using Case Series Criteria and Case Series Name with other objects. Otherwise, you may receive undesirable results.To view the active case series, navigate to Query Results, Case Series, and select Active in Argus Insight.
To make a different case series active, navigate to Query Results, Case Series, and select Library in Argus Insight. When the CASE SERIES LIBRARY page opens, select the case series you want to make active and click Make Active.
After you have selected the required data mart fields and generated the output, you can use the various Query Studio options to edit the report, change the report layout, run the report in specific formats, and save the report.
To access Query Studio's report editing options, select the Edit Data menu option. The report editing options let you control what data appears in your report as well as how it is formatted, calculated, and sorted. None of the edit operations you perform are stored in the database.
This topic only explains the basic report editing operations in Query Studio. For detailed information, see the documentation supplied with the Cognos8 products.
Use the filtering option to reduce data in your report.
To filter your report:
In the report output area, click within the header of the column you want to use to filter the report output. The selected column is highlighted.
Select Filter from the Edit Data menu options in the left frame. The Filter section appears below the report output in the right frame. The Show only the following list displays all the values in the column you selected.
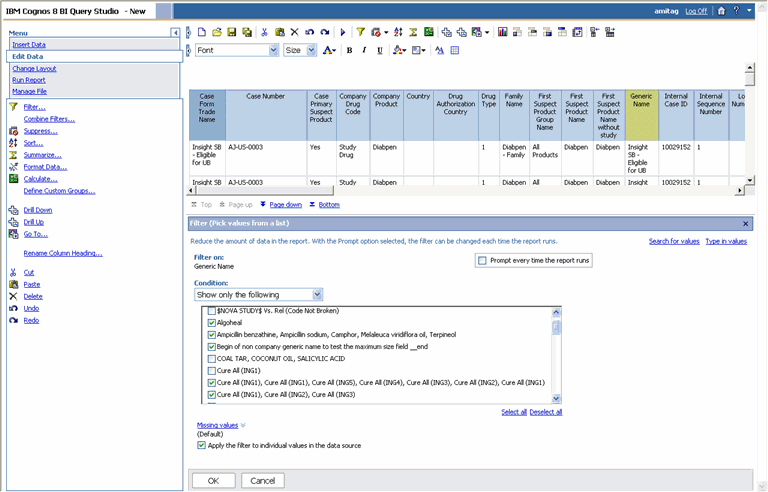
In the Show only the following list, check the values by which you want to filter the report output.
Note:
The Show only the following list may not display all the values if the list of values is very large. If you cannot find the desired values to filter on, click the Search for values link and search for the value by typing the value you are looking for.If you want the system to prompt you to select the filter values each time you run the report, select the Prompt every time the report runs check box.
If you want the report output to include those records which have a null value (no value) in the selected filter column, select the Show missing values check box.
Click OK. The system refreshes the report and displays the filtered output. The filter information is displayed above the report output.
To change the sort order in your report:
In the report output area, click within the header of the column that contains the values by which you want sort the report output. The selected column is highlighted.
Select Sort from the Edit Data menu options in the left frame. The Sort section appears below the report output in the right frame.
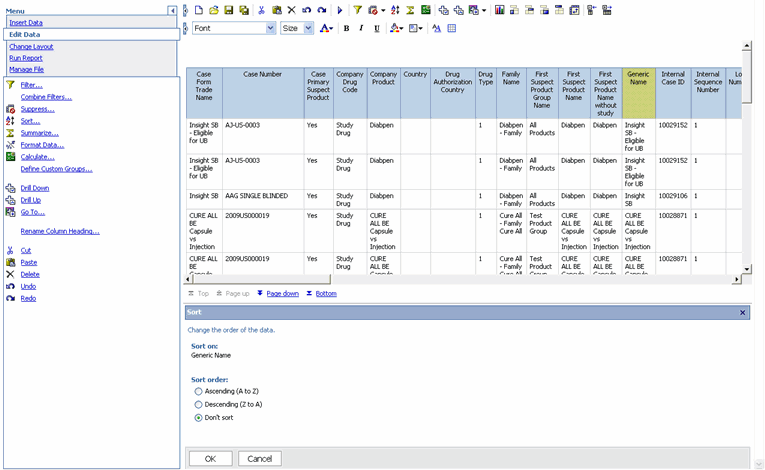
Select the required sorting option by using the Sort Order option.
Click OK. The system refreshes the report and displays the sorted output.
Use the predefined summary options to calculate the total, count, maximum, minimum, or average of the values in columns of your reports. The summary options available to you depend on the type of data in the column you want to summarize. For example, you can only use the Count option if your column contains text data whereas you can use total, maximum, minimum, or average options if the column contains numeric data.
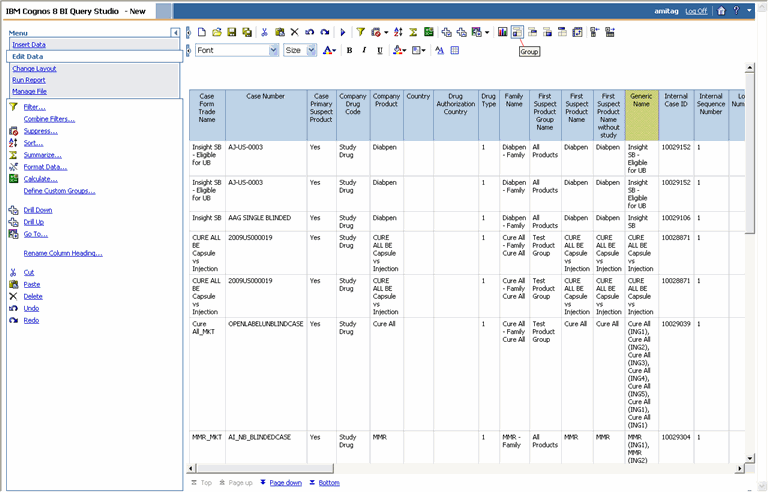
In the report output area, click the column that you want to summarize. The selected column is highlighted.
Select the column to be grouped and click on the Group icon placed in the grouping menu in the top panel. The selected column is grouped.
Select Summarize from the Edit Data menu options in the left frame. The Summarize section appears below the report output in the right frame.
Click the Summary for footers drop-down list and select the required summary option. The options available depend on the type of values the select column contains.
Click OK. The report output displays the column summary at the bottom of the report. Click the Bottom link to view the footer. If your report is grouped, the summary values are displayed for each group.
To remove summary information, select the relevant column and click Summarize. Select None from the list and click OK.
You can use predefined formats to change the appearance of text, numbers, currency, dates, and times in your report. Formatting does not change the underlying data. Table 9-1 describes the available formatting options.
Table 9-1 Formatting Options for Data in Reports
| Format | Description |
|---|---|
|
Default |
The default format is the format of the report item before any formatting is applied in Query Studio. Use default to remove formatting. |
|
Text |
Use the text format to specify the number of characters that must be visible in the text string. |
|
Number |
Use the number format to change the number of decimal places, to specify whether to use a thousands separator, to choose different symbols to represent negative numbers, and to scale large numbers. |
|
Currency |
You can choose from many world currencies. Use either the currency symbol or the international code. For example, the currency symbol for the euro is € and the international code is EUR. In addition, you can change the number of decimal places, specify whether to use a thousands separator, choose different symbols to represent negative numbers, and to scale large numbers. |
|
Percentage |
This format shows a number multiplied by 100, using two decimal places and a percent sign. For example, 0.7356 appears as 73.56%. |
|
Scientific |
This format shows a number in exponential notation. For example, the number 224,110 is 2.24110E+05 in scientific notation. |
|
Date and Time |
You can choose from a list of date and time formats, including the 12 or 24 hour clock. |
To change the format of the data in a report:
Display the report output.
Click within the header of the column that you want to format. The selected column is highlighted.
Select Format from the Edit Data menu options in the left frame. The Format section appears below the report output in the right frame.
Select the data format from the Category drop-down list, as appropriate. The options for setting the format appear.
Set the formatting options, as appropriate.
Click OK. The report output is refreshed and displays the formatted data.
While the Summary option lets you display calculation results in report footers, the Calculate option lets you create a new column that displays the calculation results for one or more columns. For example, you can perform the following types of calculations:
An arithmetic calculation between several columns in a report
Analytic operations, such as maximum, minimum, average, or percentile, in grouped reports
Percentage operations, such as percentage of total or percentage of difference
Operations on text, such as concatenating text in two columns or abbreviating text in a column
The type of calculations or operations available to you depend on the type of information in a column.
In the report output area, select the columns on which you want to perform calculations. The selected columns are highlighted.
Select Calculate from the Edit Data menu options in the left frame. The Calculate section appears below the report output in the right frame.
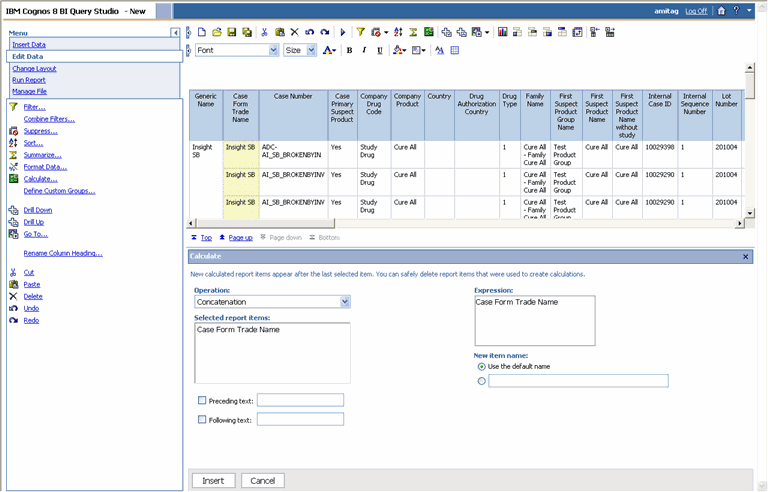
Click the Operation Type drop-down list and select the type of operation you want to perform. The operation types available depend on the type of information the selected columns contain, such as text or numeric.
Click the Operations drop-down list and select the operator. The operators available depend on the type of operation you specified.
Depending on the operator you selected, additional options may appear in the Calculate section. Specify those options.
Use the New item name options to specify whether you want the result column to have a new header title.
Click Insert. The system refreshes the report output and displays the calculation result.
To access Query Studio's report layout options, select the Change Layout menu option. The layout options let you change the appearance of your reports without changing the underlying data. For example, you can convert your report into a chart or group the report into crosstab column headers. You can also group your report by a specific column, swap rows and columns, or create sections within your report.
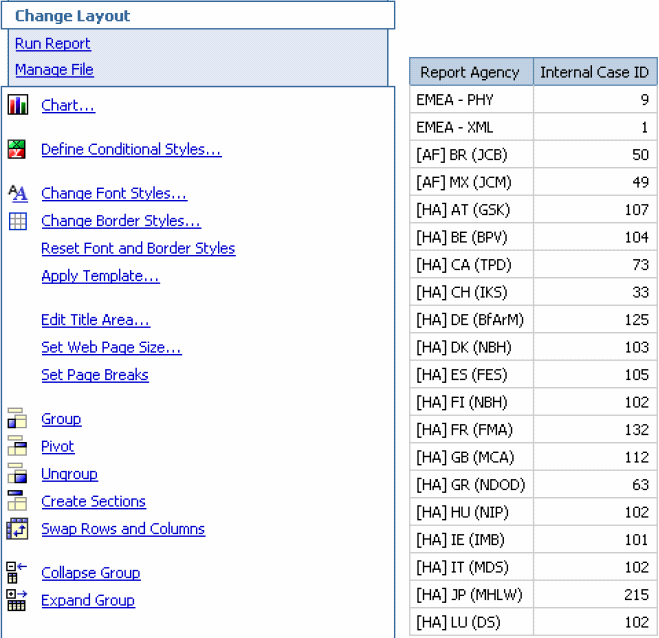
The sections explain how to use the various report layout options.
Note:
This topic only describes the basic layout operations in Query Studio. For detailed information, see the documentation supplied with the Cognos 8 products.Use the Chart option to graphically see patterns and trends in data. Charts can only be created for reports that contain measures (numeric values).
To create a chart from a report:
While your report is displayed, select the Chart from the Change Layout menu options. The Chart section appears below the report output in the right frame.
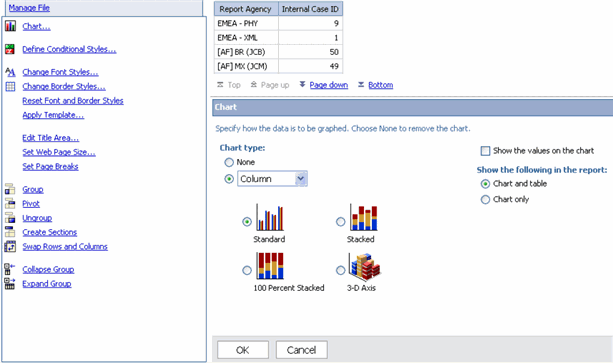
Use the Chart type drop-down list to select the type of chart you want to create. For example, column, pie, radar, and so on.
Check the Show the values on the chart check box if you want to display the measure value in the chart.
Use the Show the following in the report options to specify whether you want the output to display only the chart or both chart and table.
Click OK. The system refreshes the report output and displays the chart.
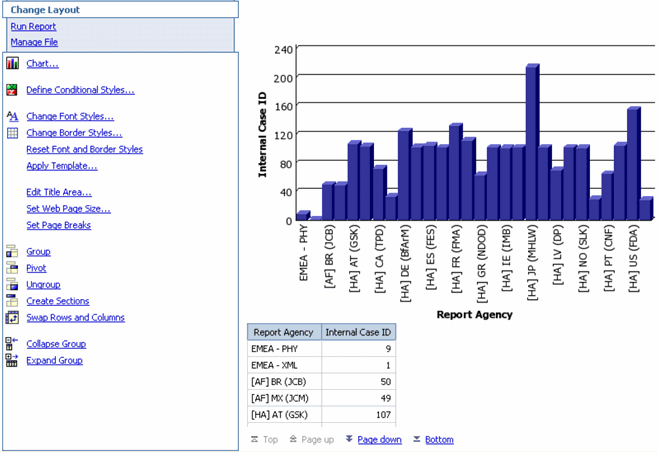
Tip:
The legends are displayed at the bottom of the screen.Use the Group option to reorder the rows of a selected column so that identical values appear together. Grouping also suppresses display of duplicates. You can group only those columns that contain text data or numeric data that is not a measure.
To group a report:
In the report output area, click within the header of the column that contains the values you want to use to group the report. The selected column is highlighted.
Select Group from the Change Layout menu options in the left frame. The system refreshes the report and displays the grouped output.
To ungroup a report, select the grouped column and select Ungroup from the Change Layout menu options.
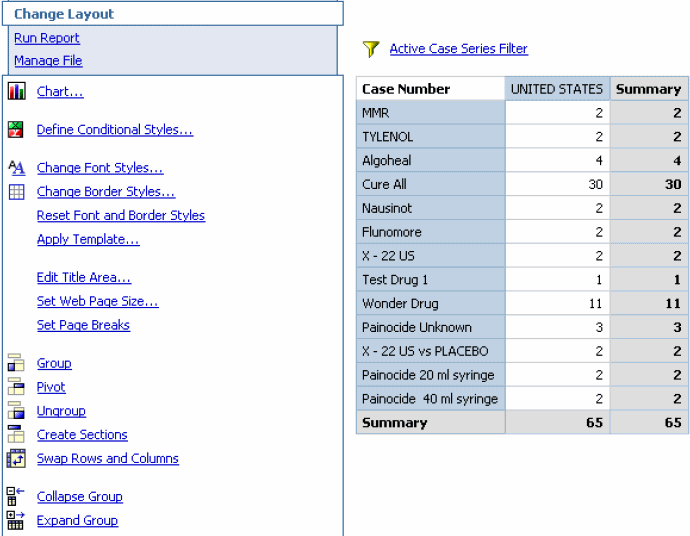
A crosstab report shows a measure at the intersection of each row and column. This type of report is useful when you need to display a large amount of data in a small area. For example, if a report shows Country as columns, Products as rows, and Case Count as the measure, the value at the intersection of each column and row shows the count of cases for that product and that country.
Note:
You cannot create crosstab reports directly in Query Studio; you cannot define measures in Query Studio. To create sophisticated reports, such as crosstab reports, use the Cognos 8 Report Studio tool. The steps that follow explain how to create a crosstab report by performing the Count operation on each cell of the Case Number column to convert it into a measure. You can use this method to create similar crosstab reports in Query Studio.To create a crosstab report using the Count operation:
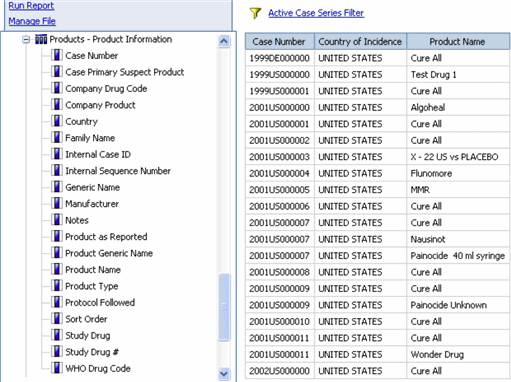
Select the following data mart fields to include in your report.
General - General Information, Case Number
General - General Information, Country of Incidence
Product - Product Information, Product Name
The Report Writer queries the data mart, automatically executes the query for every field you selected, and displays the data for the selected fields in the report output area within the right frame. The fields you selected are displayed as columns in the report output.
Convert the Case Number column values into counts.
Select the Edit Data menu. The Edit Data menu options are displayed.
Select the Case Number column by clicking within the column. The Case Number column is highlighted.
To summarize the sections in a report:
Select the Summarize option from the Edit Data menu. The Summarize section appears below the report output.
Click the Advanced link in the Summarize section. Additional options appear.
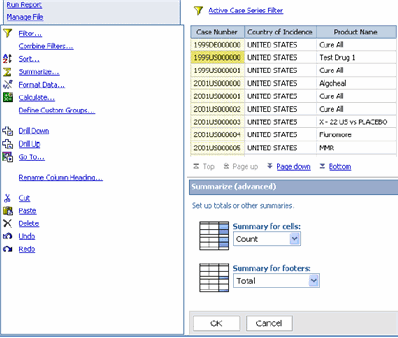
Select Count from the Summary for cells drop-down list.
Select Total from the Summary for footers drop-down list.
Click OK. The report output refreshes. The Case Number column now shows the case count for each row.
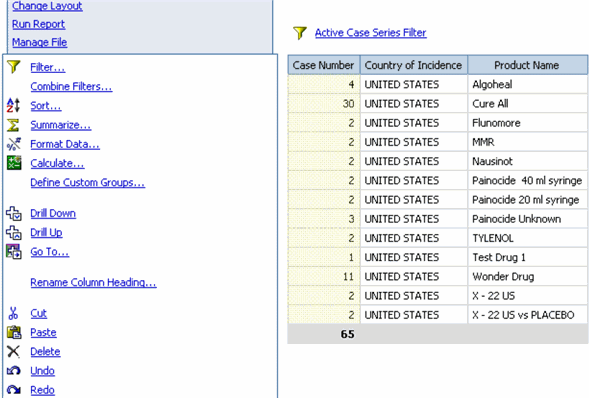
To convert to a crosstab report:
Select the Change Layout menu. The Change Layout menu options are displayed.
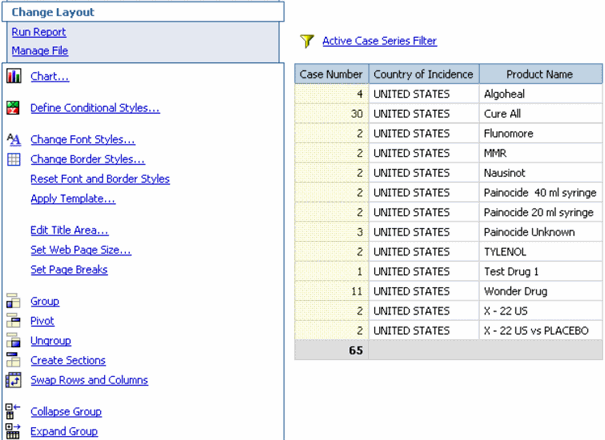
Select the Country of Incidence column in the report output. The column is highlighted. The values of the selected column will appear as columns in your crosstab report.
Select the Pivot from the Change Layout menu options. The report output refreshes. The crosstab report is displayed.
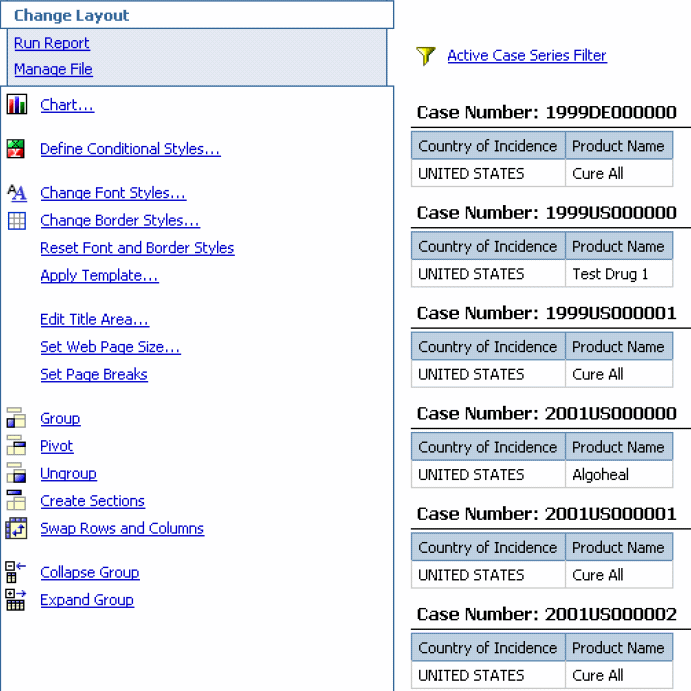
Use the Create Sections option to group your report into section headings. The section headings are based on the values within a column you select.
In the report output area, select the column you want to use for creating sections. The selected column is highlighted.
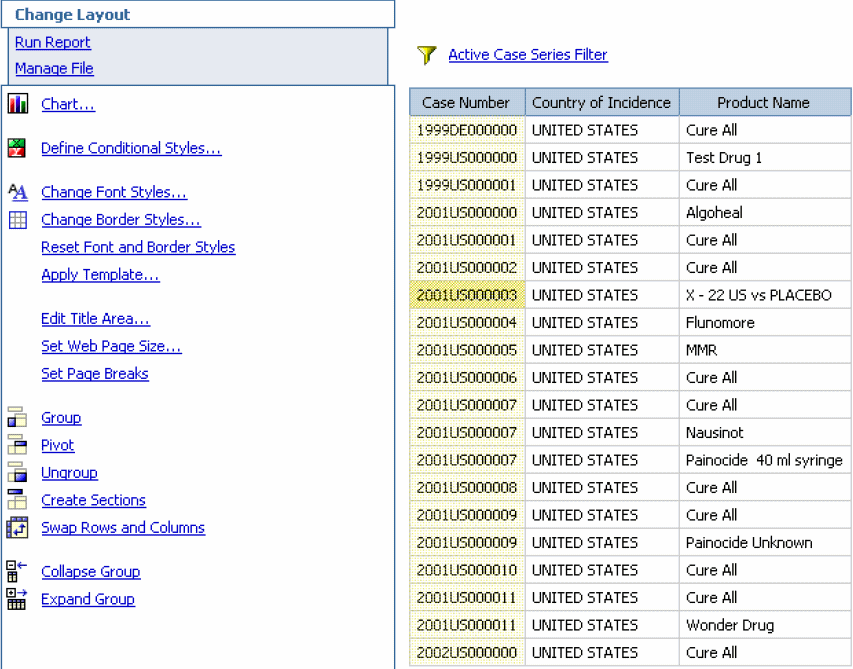
Select Create Sections from the Change Layout menu options. The report output refreshes. The report is grouped into sections.
The Swap Rows and Columns option in the Change Layout menu lets you interchange rows and columns in a crosstab report or a chart based on a crosstab. However, this option does not let you swap rows and columns in a list report.
Swapping rows and columns is useful in situations where a crosstab report has few rows and many columns.
For example, to make the report shown in the previous section easier to read, select Swap Rows and Columns to interchange rows with columns.
If there are multiple rows or columns in a crosstab report, the outermost rows become the outermost columns, and the outermost columns become the outermost rows.
Query Studio provides you many options to run or preview a report. You can access its various run and preview options by selecting the Run Report menu item. Select the desired option to run the report.
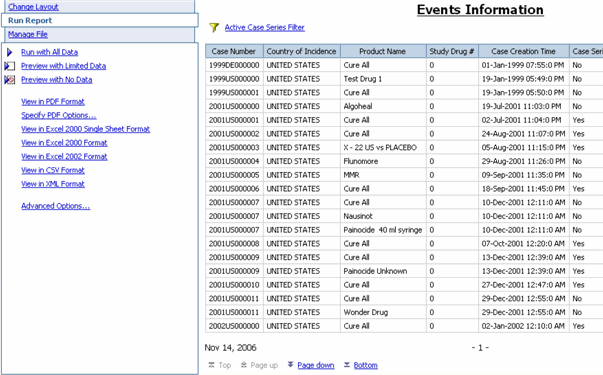
The following table describes the various Run Report options available in Query Studio.
| Option | Description |
|---|---|
| Run with All Data | Select this option to run the report using the full data mart. Running a report with all data can take a long time. If you plan to make several changes to a report, you may run the report by selecting the Preview with Limited Data option to limit the rows of data that your report retrieves. |
| Preview with Limited Data | Select this option to preview the report by retrieving limited data from the data mart. The report output has a torn border at the top and bottom of your report. |
| Preview with no Data | Select this option to preview your reports with no data. The system displays junk characters in the report and the data mart is not queried at all. |
| View in PDF Format | Select this option to save a snapshot of your report data in PDF format. Select Specify PDF Options to set the display options for the PDF output. |
| View in Excel Single Sheet Format | Select this option to save a snapshot of your report data in a single data sheet in XLS format. |
| View in Excel Format | Select this option to save a snapshot of your report data in XLS format. |
| View in CSV Format | Select this option to save a snapshot of your report data in comma separated values (CSV) format. |
| View in XML Format | Select this option to view list reports in XML format. You cannot view charts or a crosstab reports in XML format. |
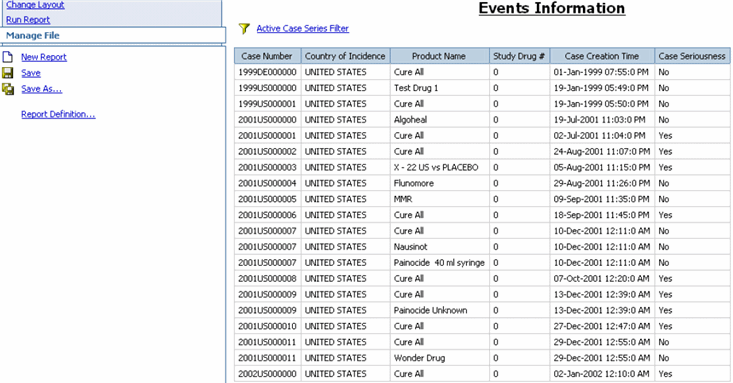
Use the Manage File menu option to save the reports you create by using Report Writer. You can save your reports in either Personal or Public folders.
The reports you save are not a snapshot of the data displayed in the report output. Instead, the system stores the specific set of instructions (data mart fields you select) for extracting data from the data mart when you run the report. For example, if you run a report that you saved a week ago, the data in the report reflects any changes in the data mart as a result of the ETL process.
To save a report:
Select the Manage File menu option in the left frame. The options for saving the report appear.
Select the Save from the Manage File menu options. The Save As section appears below the report output in the right frame.
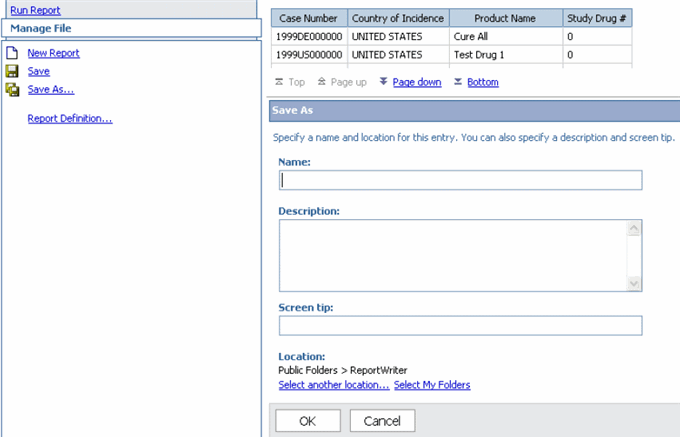
Enter the report name in the Name field.
Enter the report description in the Description field.
Enter the tip text in the Screen tip field. This text displays on the screen when the user points the cursor at the report in the Report Writer.
Select a Location option to specify where the report needs to be saved.
Click Select another location if you want all users to be able access the report.
Click Select My Folders if you want to save the report as a personal document.
To save a report in a new folder:
Click Select another location. The Select a Location section appears.
Select the Public Folders or My Folders tab, and click the New Folder.
Specify the name, description, and screen tip for the new folder and click Finish.
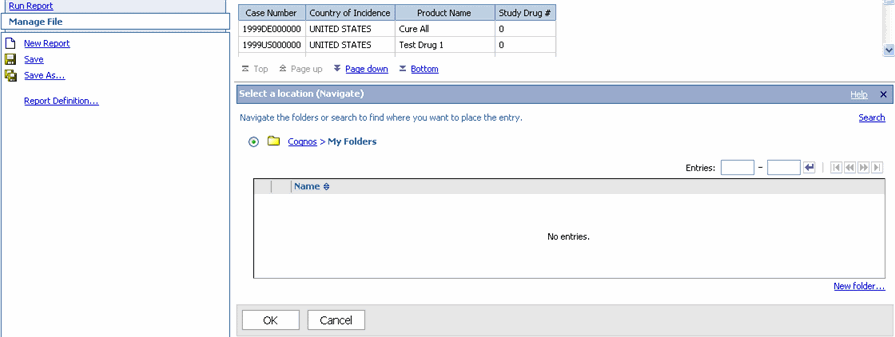
Click OK to save the report in the location you specified.
You can access the reports that you saved from the Report Writer library.
To open the Report Writer library, navigate to Case Series Reports, Report Writer, and select Library. My Folders is the default location that appears when you open the Report Writer library. All the reports you save as personal documents are listed in the My Folders location.
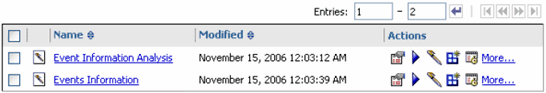
To view the reports saved as public documents select the Public Folders tab. You can navigate the public folders and display the desired report.
To run the saved report, select the check box next to the report name and click the Run icon. If there are any filtering prompts associated with the report, they are displayed. Specify the prompt values and click OK to view the report output.
To edit a saved report, click the report name. The report opens in Query Studio. After you edit the report, open the Manage Files menu and select Save As to save the report by another name.
If you select an SMQ, all the cases based on that SMQ are displayed.
To use SMQs in Report Writer:
Navigate to Case Series Reports, Report Writer, and select New. The following window is displayed.
Expand the Report Writer control tree to display the various data mart views.
Under Events - Event Information, either double-click Event SMQ (Broad) or drag-and-drop it to the right pane.
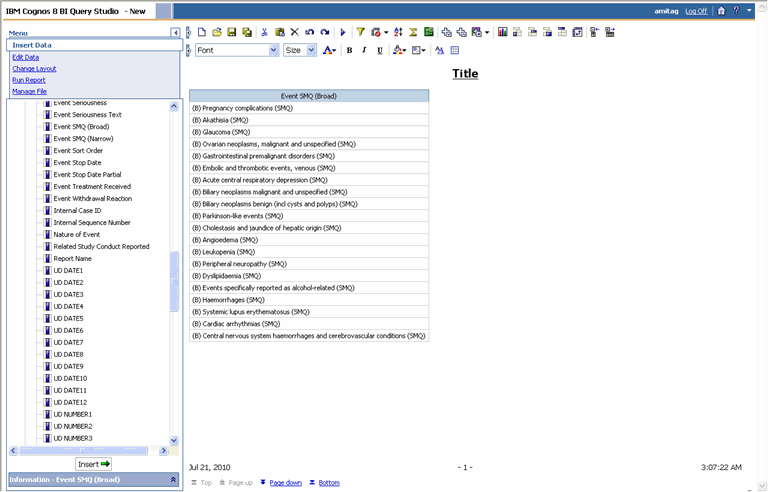
Perform a similar operation as shown in the previous step for Event SMQ (Narrow).
Under Events - Event Information, either double-click Case Number or drag-and-drop it to the right pane. This displays all the case numbers that correspond to the selected SMQ.
|
Copyright © 2011, 2012, Oracle and/or its affiliates. All rights reserved. Legal Notices |
|