26 Monitoring Performance by Using Oracle Access Manager Console
There are several methods to view performance metrics. This chapter provides the following topics, with emphasis on using Oracle Access Manager Console:
See Also:
-
Chapter 27 to use Oracle Enterprise Manager Fusion Middleware Control to monitor Oracle Access Manager performance metrics
26.1 Introduction to Performance Monitoring
Oracle Access Manager uses the Oracle Dynamic Monitoring Systems (DMS) to measure application-specific performance information for OAM Servers and registered OAM Agents.
Metric collection is the mechanism by which components collect information in memory for particular events. Based on these events, you can monitor the time spent in a particular area or track particular occurrences or state changes. These metrics are kept only in memory and there are several mechanisms to extract and display them: EM, dmsSpy, dmsDump, for instance.
dmsSpy is a Fusion Middleware tool that is part of the WebLogic Application Server. dmsSpy displays the raw DMS data specific to the WebLogic Application Server instance. Displayed information is categorized by Noun Types (OAMS.OAM_ prefix for Oracle Access Manager 11g) and includes metrics pertaining to all DMS instrumented applications running in the Weblogic Application Server instance. To see the metrics on a Weblogic instance, go to http://hostname:port/dms/. For example:
http://adc1234:7001/dms/
See Also:
-
Oracle Fusion Middleware Performance and Tuning Guide for details about instrumenting applications with DMS
Administrators can monitor performance for Oracle Access Manager 11g using the Monitoring command on the Actions menu under the System Configuration tab.
26.2 Monitoring Server Performance Metrics Using the Console
This section provides the following topics:
26.2.1 Monitoring Server Instance Performance
Users with valid OAM Administrator credentials can use the following procedure to display various performance metrics using the Oracle Access Manager Console.
The server must be running.
To monitor performance using Oracle Access Manager Console
-
Go to the System Configuration tab.
-
Server Instance:
-
From the Common Configuration section, locate and select the name of the server instance to monitor.
-
From the Actions menu, click Monitor Menu.
-
Click the desired subtab to view the results for the selected server instance:
Server Processes Overview
Session Operations
Server Operations
OAM Agents -
Proceed to Reviewing Server Metrics.
-
-
OSSO Agent: On the instance page that opens, view the results.
-
Processes Overview
-
Operation Detail
-
26.2.2 Reviewing Server Metrics
This topic provides a look at the Server metrics available when you have a server instance selected in the navigation tree and you choose the Monitoring Menu command on the Actions menu under the System Configuration tab.
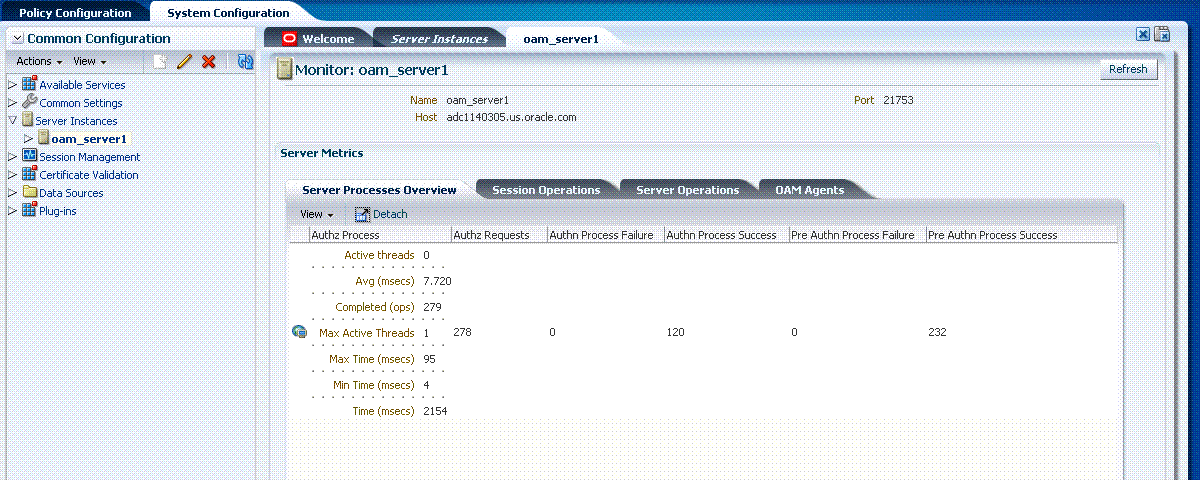
Figure 26-1 shows the Server Processes page.
Figure 26-1 Server Processes Overview Page
Description of "Figure 26-1 Server Processes Overview Page"
Server Processes Overview provides the following OAM Server performance metrics:
-
Authorization Process
-
Authorization Requests
-
Authentication Process Failure
-
Authentication Process Success
-
Pre Authentication Process Failure
-
Pre Authentication Process Success
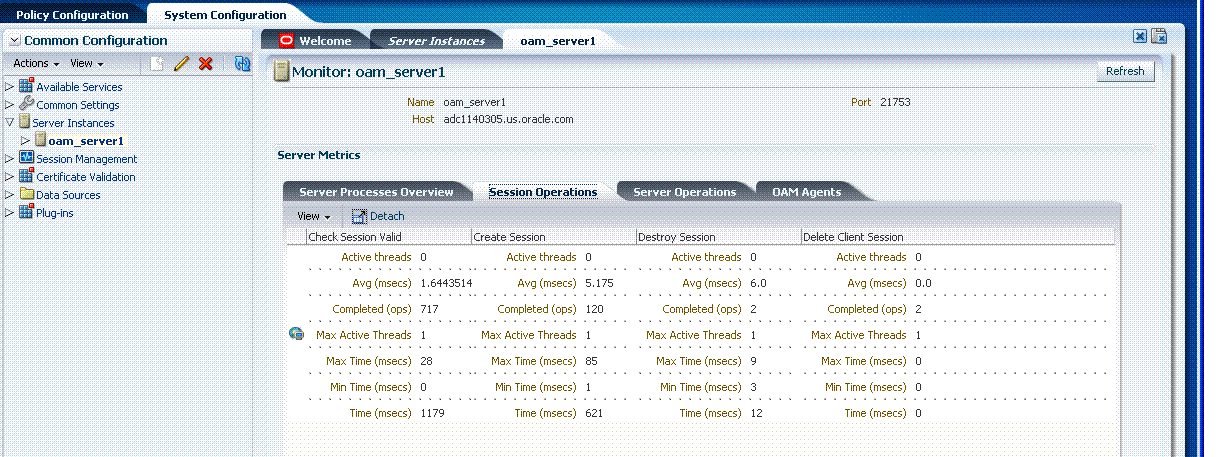
Figure 26-2 shows the Session Operations Monitoring page.
Figure 26-2 Session Operations Monitoring Page
Description of "Figure 26-2 Session Operations Monitoring Page"
Session Operations performance metrics include:
-
Check Session Valid
-
Create Session
-
Destroy Session
-
Delete Client Session
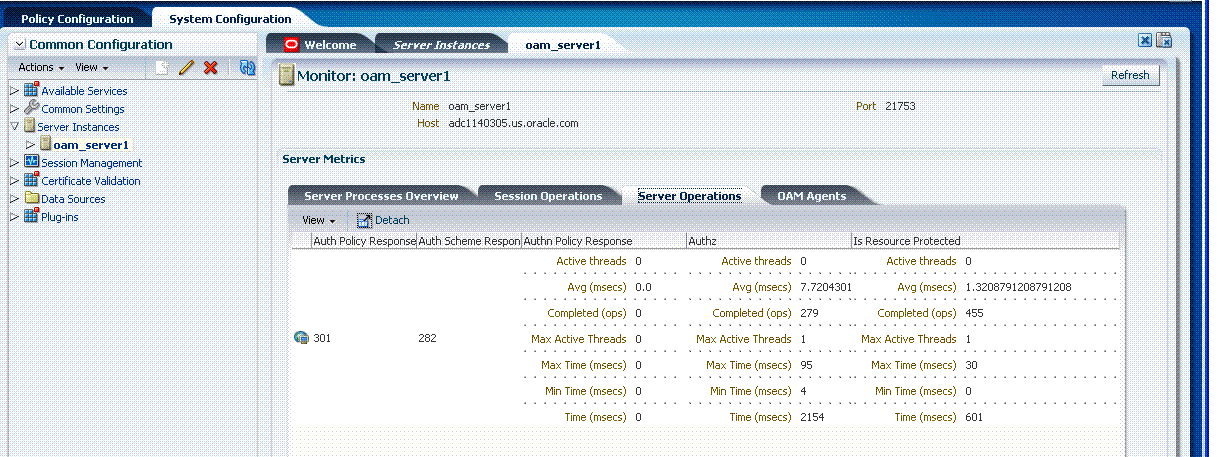
Figure 26-3 shows the Server Operations Monitoring page.
Figure 26-3 Server Operations Monitoring Page
Description of "Figure 26-3 Server Operations Monitoring Page"
Server Operations performance metrics include:
-
Authentication Policy Response success
-
Authentication Scheme Response success
-
Authentication Policy Response
-
Authorizations
-
Statistics for Protected Resource
Figure 26-4 shows the Agents Monitoring page.
OAM Agent performance metrics include:
-
Name
-
Status
-
Version
26.3 Monitoring SSO Agent Performance Metrics
This section describes how to review metrics for various components and how to determine whether tuning is needed. The following topics are included:
26.3.1 Monitoring SSO Agent Performance Metrics
Users with valid OAM Administrator credentials can use the following procedure to display various SSO Agent performance metrics using the Oracle Access Manager Console.
The server and agent must be running.
To monitor SSO Agent performance using Oracle Access Manager Console
-
Go to the System Configuration tab, Access Manager Settings section.
-
Open the SSO Agents node, and then open the desired agent type node:
-
OAM Agents
-
OSSO Agents
-
-
Search for the desired agent to monitor using the controls for the open node.
-
In the Search Results table, highlight the row containing the agent you want to monitor.
-
Proceed as needed.
26.3.2 Reviewing OAM Agent Metrics
Figure 26-5 shows the OAM Agent monitoring characteristics.
See Also:
Figure 26-5 OAM Agent Monitoring Characteristics

Description of "Figure 26-5 OAM Agent Monitoring Characteristics"
Following figures illustrate detached tables:
-
Figure 26-7, "Detached OAM 10g Agent Operations Overview Table"
-
Figure 26-8, "Detached OAM 10g Agent Operations Detail Table"
Figure 26-6 Detached OAM 10g Agent Connection Table

Description of "Figure 26-6 Detached OAM 10g Agent Connection Table "
Figure 26-7 Detached OAM 10g Agent Operations Overview Table

Description of "Figure 26-7 Detached OAM 10g Agent Operations Overview Table "
Figure 26-8 Detached OAM 10g Agent Operations Detail Table

Description of "Figure 26-8 Detached OAM 10g Agent Operations Detail Table "
Figure 26-9 Detached OAM 10g Agent Information Table

Description of "Figure 26-9 Detached OAM 10g Agent Information Table "
26.3.3 Reviewing OSSO Agent Metrics
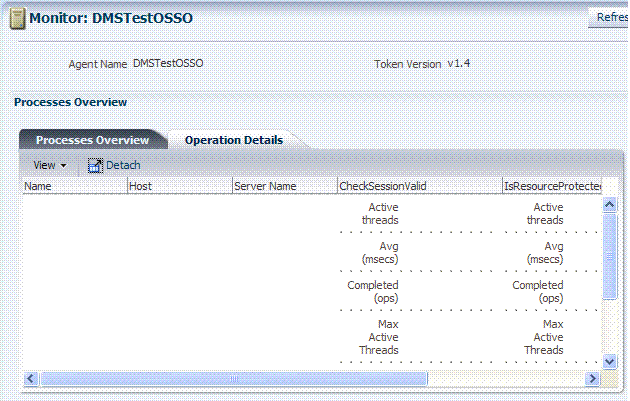
When you have an OSSO Agent selected in the navigation tree and choose Monitor Menu from the Actions menu, the following metrics pages are available:
-
Figure 26-10, "OSSO 10g Agent Monitoring Page with Operation Details"
-
Figure 26-11, "OSSO 10g Agent Monitoring Process Overview Table Detached"
Figure 26-10 OSSO 10g Agent Monitoring Page with Operation Details
Description of "Figure 26-10 OSSO 10g Agent Monitoring Page with Operation Details"
Figure 26-11 illustrates the detached OSSO 10g Agent Monitoring Process Overview table.
Figure 26-11 OSSO 10g Agent Monitoring Process Overview Table Detached
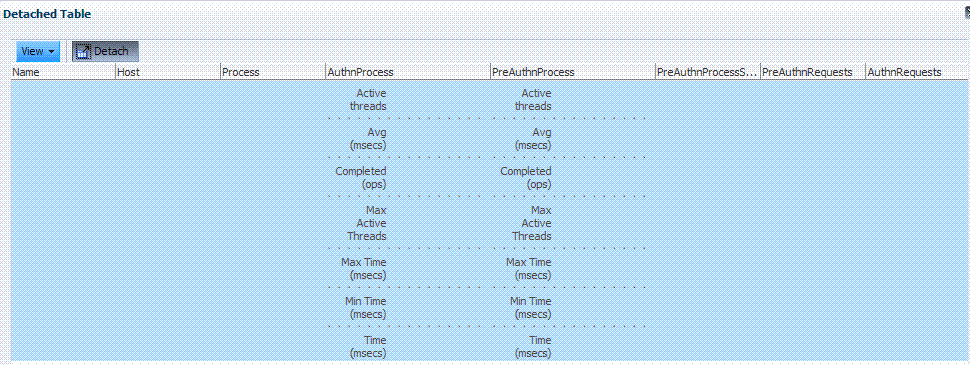
Description of "Figure 26-11 OSSO 10g Agent Monitoring Process Overview Table Detached"
Figure 26-12 illustrates the detached OSSO 10g Agent Information table.
Figure 26-12 OSSO 10g Agent Information Table Detached

Description of "Figure 26-12 OSSO 10g Agent Information Table Detached"
26.4 OXM Proxy Performance Tuning Parameters
Performance of the OAM Proxy can be tuned by changing its configuration through the Java EE container Administration Console. Both the Java EE container Administrator and the Administrator can tune performance.
This section provides the following topics:
26.4.1 About OAM Proxy Metrics
The OAM Proxy provides the same or comparable throughput as the Oracle Access Manager 10g Access Server. Throughput refers to the number of requests processed per second. Latency refers to the time required to process a particular request. There is less than a 20% latency increase with the introduction of a proxy between Webgate and OAM Server.
| Metric | Description |
|---|---|
|
handshakes.active |
Number of active threads doing handshake |
|
handshakes.avg |
Average time spent performing initial handshake |
|
handshakes.completed |
Number of times an initial handshake has been executed |
|
handshakes.maxTime |
Maximum time spent performing initial handshake |
|
handshakes.minTime |
Minimum time spent performing initial handshake |
|
handshakes.time |
Total time spent performing initial handshake |
|
failedHandshakes.count |
Count of failed handshakes |
|
peerCompatibilityFailures.count |
Count of how many Peer Compatibility Check Failures have happened |
|
openSecurityMode.count |
Count of how many Open Security Mode handshakes have happened |
|
simpleSecurityMode.count |
Count of how many Simple Security mode handshakes have happened |
|
SSLSecurityMode.count |
Count of how many SSL Security Mode handshakes have happened |
|
negotiateSecurityMode.active |
Number of active threads doing security mode negotiation |
26.4.2 OAM Proxy Server Tuning Parameters
Table 26-2 provides the tuning parameters for the OAM Proxy.
Table 26-2 OAM Proxy Tuning Parameters
| Purpose | Parameter | Type | Value | Description |
|---|---|---|---|---|
|
Throttle |
MaxGlobalBufferSize Note: Proxy server can limit (throttle) the quantity of requests within a specified amount of time not to be exceeded by the proxy server to avoid crashes due to unavailability of resources (like memory. In such cases, a status code is returned indicating that the client should temporarily route requests to other servers |
Integer |
The maximum memory in KB of the message queue across all the connections. If this value is exceeded, OAM proxy will not accept further requests on a connection. If a value of 0 or less than 0 is specified, this parameter will not be used |
|
|
Denial of Service Attacks |
ConnectionValidationInterval |
Integer |
120 |
The time interval in seconds for validating the connections periodically for denial of service attacks |
|
BacklogQueue |
Integer |
50 |
Maximum length of backlog queue |
|
|
MaxNAPHandShakeTime |
Integer |
100 |
The maximum time in milliseconds within which the client should complete the NAP handshake with client. If NAP handshake over a connection is not completed within this time, the connection will be marked as malicious |
