5 Engage Reports
"Engage" reports display statistics on the usage of recommendations and recommended assets by segment.
The "Engage" reports presented in this chapter are:
5.1 'Recommendations' Report
The "Recommendations" report analyzes the recommendations that visitors accessed on the given site during the reported time period. The report can be generated in three display modes: daily, weekly, and monthly.
5.1.1 'Recommendation Overview' Chart
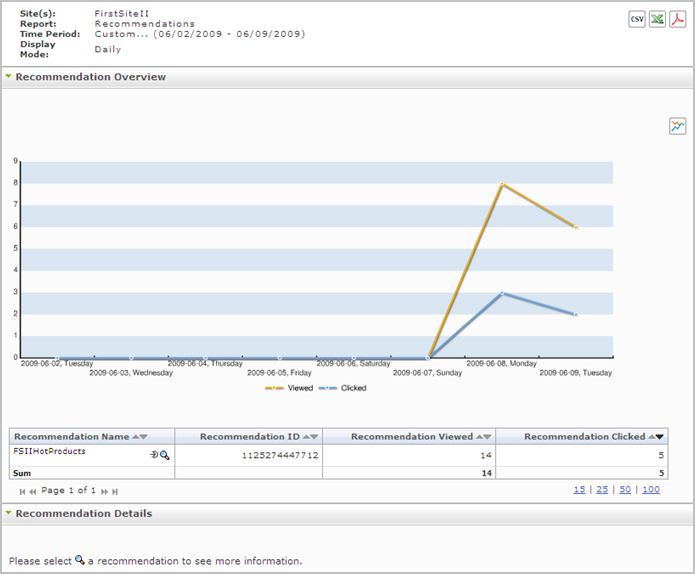
The "Recommendation Overview" chart plots the data shown in the table directly underneath it:
-
Each point on the yellow "Viewed" graph represents the sum of the number of times the recommendations listed in the table below the chart were viewed on the corresponding day, during the reported time period.
-
Each point on the blue "Clicked" graph represents the sum of the number of times the recommendations (and the assets they reference) listed in the table below the chart were clicked on the corresponding day, during the reported time period.
-
The x-axis reports the date on which the number was observed.
This chart tabulates the total number of times that a given recommendation was accessed during the reported time period. For a description of each statistic, see Table 5-1.
Table 5-1 "Recommendation Overview" Chart
| Mode | Column Title: Description |
|---|---|
|
Daily, Weekly, Monthly |
Recommendation Name column: Name of the recommendation that was accessed during the reported time period (specified in the report header). Clicking the Drill down icon opens the "Segments" report to correlate the recommendation with the interested segments (see Section 5.2, "'Segments' Report"). Recommendation ID column: Randomly generated number that Engage and WebCenter Sites use to identify the recommendation. Recommendation Viewed column: Number of times that visitors were referred to the recommendation during the reported time period. Note that the visitors do not actively select or browse the recommendation. Rather, they are led to the recommendation by links on other sites. Recommendation Clicked column: Number of times that visitors clicked the recommendation (or one of the assets referred by it) during the reported time period. Each click registers an impression on the page, indicating that the recommendation was actively selected by the visitor. |
For each recommendation listed in this table, you have the following options available:
-
Click a recommendation's Drill Down (bullet-head) icon, to display the Section 5.2, "'Segments' Report" and Section 5.2.2, "'Segments' List" for the recommendation.
-
Click a recommendation's Details (magnifier) icon to display data pertaining to this recommendation in the Section 5.1.2, "'Recommendation Details' Chart."
5.1.2 'Recommendation Details' Chart
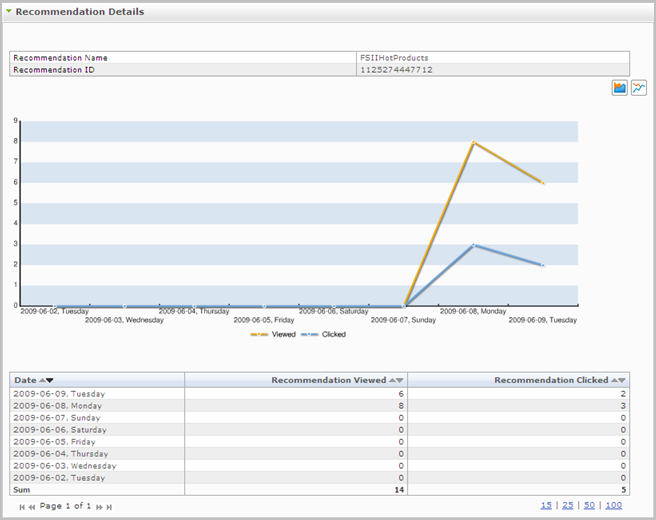
Figure 5-2 "Recommendation Details" Report

Description of "Figure 5-2 "Recommendation Details" Report"
The "Recommendation Details" chart plots the data shown in the table underneath it:
-
Each point on the yellow "Viewed" graph represents the number of times the given recommendation was viewed on the corresponding day, during the reported time period.
-
Each point on the blue "Clicked" graph represents the number of times an asset recommended by the given recommendation was clicked on the corresponding day, during the reported time period.
-
The x-axis reports the date on which the number was observed.
The "Recommendation Details" chart tabulates how many times recommendations were viewed or clicked during each day (week or month) in the reported time period. For a description of each statistic, see Table 5-2.
Table 5-2 "Recommendation Details" Chart
| Mode | Column Title: Description |
|---|---|
|
Daily, Weekly, Monthly |
Date column: Day (week or month) on which recommendations were accessed.
Recommendation Viewed column: Number of times that visitors were referred to the recommendation during the reported time period. Note that the visitors do not actively select or browse the recommendation. Rather, they are led to the recommendation by links on other sites. Recommendation Clicked column: Number of times that visitors clicked the recommendation (or one of the assets it references) during the reported time period. Each click registers an impression on the page, indicating that the recommendation was actively selected by the visitor. |
5.2 'Segments' Report
The "Segments" report analyzes the segments whose members accessed Engage assets during the reported time period. The report can be generated in three display modes: daily, weekly, and monthly.
5.2.1 'Segment Chart'
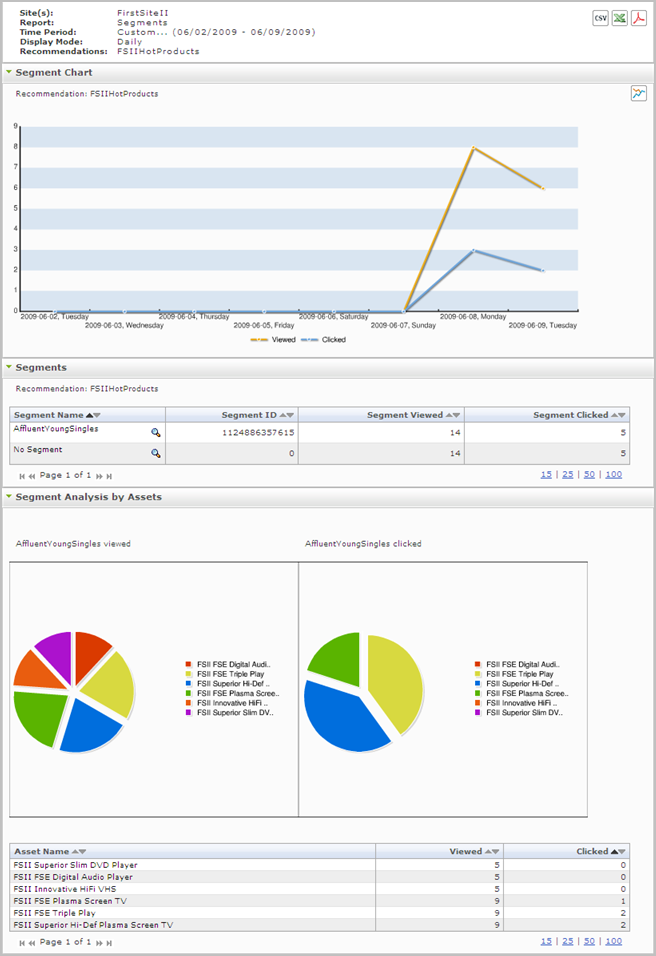
The "Segment Chart" is a line chart that plots the number of times that a given segment viewed or clicked the recommendation that is named below the "Segment Chart" label. The x-axis reports the date on which the number was observed. For a definition of viewed and clicked, see Table 5-3.
5.2.2 'Segments' List
The "Segments" list tabulates statistics for the individual segments that issued requests for recommendations. For a description of each statistic, see Table 5-3.
Table 5-3 "Segment Analysis by Assets" Chart
| Display Mode | Column Title: Description |
|---|---|
|
Daily, Weekly, Monthly |
Segment Name column: Name of the segment that issued requests for the recommendation. (The recommendation is identified directly below the "Segment Analysis" label.) Clicking the chart icon opens an additional chart named "Segment Analysis by Assets," showing which recommended assets were clicked and visited by segment members, and in which proportions the recommended assets were clicked and visited. The chart icon is shown below: Segment ID column: Randomly generated number that Engage uses to identify the segment. Segment Viewed column: Number of times that members of this segment were referred to recommendations during the reported time period. Note that the members do not actively select or browse the recommendations. Rather, they are led to the recommendations by links on other sites. Segment Clicked column: Number of times that members of this segment clicked recommendations on the site during the reported time period. Each click registers an impression on the page, indicating that the recommendation was actively selected by the member. |
5.2.3 'Segment Analysis by Assets' Chart
The "Segment Analysis by Assets" chart analyzes a segment in terms of the recommended assets its members viewed (were led to) and clicked. For example, the left-hand pie chart on Section 5.2, "'Segments' Report," shows which recommended assets were viewed by the segment during the reported time period, and in which proportions. The right-hand pie chart shows which recommended assets were clicked and in which proportions.

