The Performance Metrics component provides performance information for queries and executions.
Depending on how the component is configured, the component can contain
information on:
- MDEX Engine queries by data source
- Portlet client executions by component
- Portlet server executions by component
By default, only the MDEX Engine queries and portlet server executions are included.
For each type of included metric, the table at the top of the component contains a collapsible section.
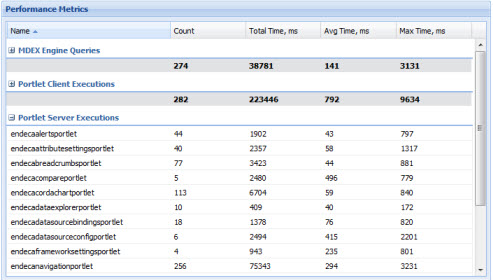
For each data source or portlet, the table tracks:
- Total number of queries or executions
- Total execution time
- Average execution time
- Maximum execution time
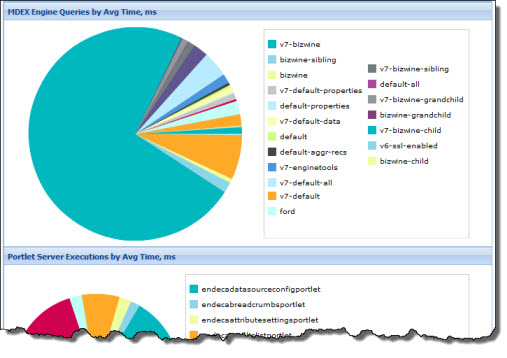
For each type of included metric, there is also a pie chart summarizing the average query or execution time per data source or component.
Note: The
Performance Metrics component provides a view
into MDEX Engine query performance, which does not correlate directly to a page
view, as there are often multiple MDEX Engine queries powering a single page.
