This topic contains an example of a horizontal bar chart.
This example uses a single GROUP BY statement with two metrics:
RETURN NumCases AS SELECT
    AVG("Unit Sale Price ($)") AS "Avg Sales Price",
    AVG("Product Avg National Sales Price ($)") AS "Avg National Sales Price"
GROUP BY "Varietals" ORDER BY "Avg National Sales Price"
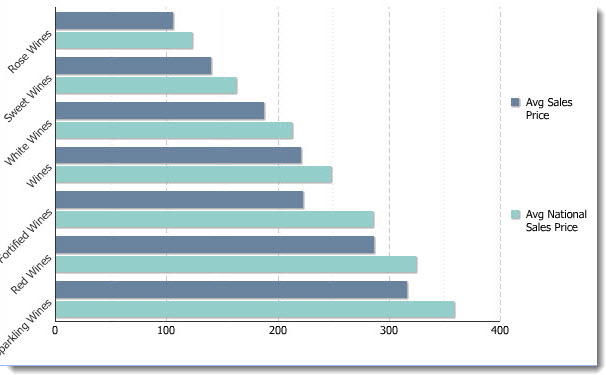
The horizontal bar chart compares the "Avg Sales Price" metric to the "Avg National Sales Price" for each varietal: