| Oracle® Fusion Middleware Administrator's Guide for Oracle SOA Suite and Oracle Business Process Management Suite 11g Release 1 (11.1.1.6.3) Part Number E10226-16 |
|
|
PDF · Mobi · ePub |
| Oracle® Fusion Middleware Administrator's Guide for Oracle SOA Suite and Oracle Business Process Management Suite 11g Release 1 (11.1.1.6.3) Part Number E10226-16 |
|
|
PDF · Mobi · ePub |
This chapter describes how to monitor recent instances and faults, deployed SOA composite applications, message delivery processing requests, and service and reference binding components in the SOA Infrastructure. All SOA composite applications are deployed to the SOA Infrastructure. It also describes how to display details about BPEL process messages that require recovery and how to access the Recovery page of the BPEL process service engine to perform message recovery.
This chapter includes the following topics:
Section 4.1, "Monitoring SOA Infrastructure Recent Instances and Faults and Deployed Composites"
Section 4.2, "Monitoring Message Delivery Processing Requests"
Section 4.3, "Monitoring Service and Reference Binding Components in the SOA Infrastructure"
For more information, see Section 1.2.1, "Introduction to the SOA Infrastructure Application."
You can monitor the SOA composite applications deployed to the SOA Infrastructure.
To monitor SOA Infrastructure recent instances and faults:
Access this page through one of the following options:
| From the SOA Infrastructure Menu... | From the SOA Folder in the Navigator... | From the SOA Composite Menu... |
|---|---|---|
|
|
|
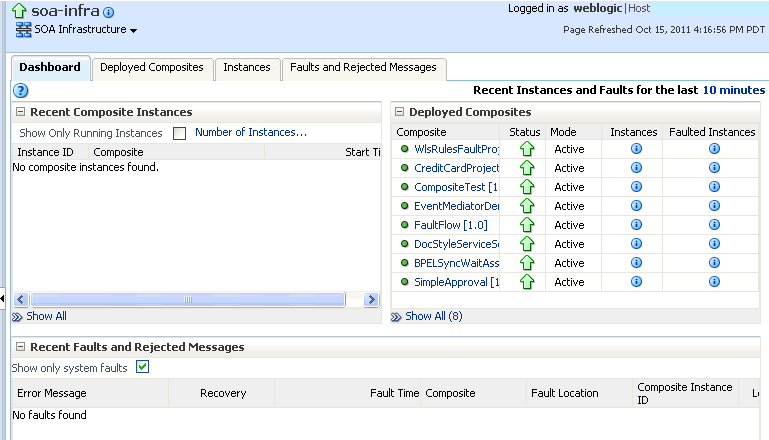
The upper part of the SOA Infrastructure Dashboard page displays the following details:
A message indicating that the retrieval of recent instances and faults that are displayed on this page is restricted to the specified time period. This message is displayed if the Restrict display of instances and faults to the last time_period checkbox is selected on the SOA Infrastructure Common Properties page (it is selected by default). The default time period value is 24 hours, but you can change this value. If this checkbox is not selected, all instances and faults (including count metrics) in the SOA Infrastructure since the last purging are displayed.
Recent SOA composite application instances, instance IDs, and starting times. By default, only running instances are shown.
The status of deployed SOA composite applications and their revision numbers, the number of instances created for each application, and the number of faulted instances in each application. The total number of deployed composites also is displayed in parentheses next to the Show All link.
Recent faults and rejected messages, including the error message, whether you can recover from the fault, the time at which the fault occurred, the SOA composite application in which the fault occurred, the location of the fault (service binding component, service component, or reference binding component), the instance ID of the SOA composite application, and a link to log messages describing the fault or rejected message. You can recover from faults identified as recoverable at the SOA Infrastructure, SOA composite application, service engine, and service component levels.
If messages are awaiting recovery from the Recovery page of the BPEL process service engine, a message is displayed at the top of each SOA Infrastructure home page.
Note:
After the SOA Infrastructure is started, it may not be completely initialized to administer incoming requests until all deployed composites are loaded. During SOA Infrastructure initialization, a warning message is displayed at the top of the SOA Infrastructure home page. Do not perform operations such as composite deployment, composite undeployment, and others while this message is displayed. For more information, see Section 3.2.1, "Waiting for SOA Infrastructure Startup Initialization to Complete."
If BPEL process messages require recovery from the Recovery page of the BPEL process service engine, the BPEL Message Recovery Required message is displayed at the top of each SOA Infrastructure home page.
The display of this message recovery information is controlled by the bpelRecoveryStatus and excludeBpelMaxCreationTime keys of the AuditConfig property in the System MBean Browser. This property is accessible from the More SOA Infra Advanced Configuration Properties section of the SOA Infrastructure Common Properties page. By default, the bpelRecoveryStatus key is set to All and the excludeBpelMaxCreationTime key is set to exclude the display of messages requiring recovery in the last five minutes.
Perform the following tasks:
| Click This Link... | To... |
|---|---|
|
View a message showing the number of invoke, callback, and activity messages that require recovery from the Recovery page of the BPEL process service engine. Manual recovery is not required if automatic recovery of BPEL messages is enabled. In that case, only exhausted messages must be manually recovered. Click Refresh to recalculate the number of invoke, callback, and activity messages requiring recovery. |
|
|
Access the Recovery page of the BPEL process service engine to perform message recovery. You can also access the Recovery page later by selecting Service Engines > BPEL from the SOA Infrastructure menu and clicking the Recovery tab in the resulting page. |
|
|
View a message showing the time period for excluding messages that require recovery. By default, this setting excludes the last five minutes of messages. This value is controlled by the excludeBpelMaxCreationTime key of the AuditConfig property on the SOA Infrastructure Common Properties page. To change this value, click Yes to access this property in the System MBean Browser. |
|
|
View a message enabling you to prevent the display of this message recovery information on the Dashboard page. If you click Yes, this message recovery information is not displayed. To display this information again on the Dashboard page, set the bpelRecoveryStatus key to All for the AuditConfig property in the More SOA Infra Advanced Configuration Properties section of the SOA Infrastructure Common Properties page. For more information, see Section 3.1, "Configuring SOA Infrastructure Properties." |
In the Recent Composite Instances section, perform the following tasks:
Click the Number of Instances link to display a message showing the numbers of running and total instances in the SOA Infrastructure. The link is not displayed by default. To enable this link to be displayed, select the Disable fetching of instance and fault count metrics. Each metric can still be retrieved on demand checkbox in the SOA Infrastructure Common Properties page.
If you selected the Restrict display of instances and faults to the last time_period checkbox on the SOA Infrastructure Common Properties page and specified a time period or accepted the default value of 24 hours, the numbers of running and total instances in the SOA Infrastructure for that time period are displayed. If you did not select this checkbox, all instances and faults in the SOA Infrastructure since the last purging are displayed. Click Recalculate to recalculate the numbers.
In the Instance ID column, click a specific instance ID to show the message flow through the various service components and binding components.
In the Composite column, click a specific SOA composite application to access its home page.
Click Show All below the section to access the Instances page of the SOA Infrastructure.
In the Deployed Composites section, perform the following tasks:
In the Composite column, click a specific SOA composite application to access its home page.
Click Show All below the section to access the Deployed Composites page of the SOA Infrastructure.
In the Recent Faults and Rejected Messages section, perform the following tasks:
In the Error Message column, click an error message to display complete information about the fault. If the fault is identified as recoverable, click the Recover Now link to perform fault recovery.
In the Recovery column, if a fault is identified as recoverable, click Recover to perform fault recovery.
In the Composite column, click a SOA composite application to access its home page.
In the Fault Location column, click a specific location to access the home page of the service, component, or reference in which the fault occurred.
In the Composite Instance ID column, click a composite instance ID to access the flow trace of the message that contains that fault.
In the Logs column, click a specific log to access the Log Messages page, with the search criteria prefiltered to display any log messages related to the fault.
Click Show All below the section to access the Recent Faults and Rejected Messages page of the SOA Infrastructure.
The lower part of the SOA Infrastructure Dashboard page displays the following details:
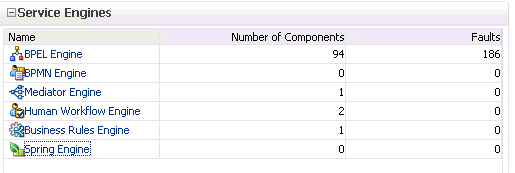
The number of service components running in the service engines (BPEL process, BPMN process (if Oracle BPM Suite is installed), Oracle Mediator, human workflow, business rules, and spring) and the number of faulted instances for each service engine.
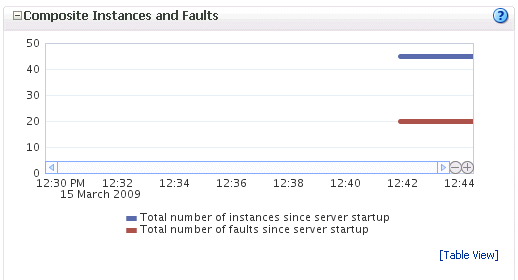
A graphical representation of the total number of instances and faults for all SOA composite applications since the SOA Infrastructure was last restarted.
In the Name column of the Service Engines section, click a specific service engine to access its home page. If you click Spring Engine, a message is displayed indicating that it cannot be managed.
For more information, see the following sections:
Section 1.2.4, "Introduction to Service Components and Service Component Instances"
Section 8.1, "Initiating a SOA Composite Application Test Instance"
Section 14.4, "Performing BPEL Process Service Engine Message Recovery"
Oracle Fusion Middleware Administrator's Guide for details about viewing and searching log files
You can monitor SOA Infrastructure message delivery processing requests. These are metrics for the message delivery between the service engines, service infrastructure, and binding components. Once a message is handed over to a service engine, the amount of time it takes to process that message (instance processing time) is not captured in these metrics.
To monitor processing requests:
Access this page through one of the following options:
| From the SOA Infrastructure Menu... | From the SOA Folder in the Navigator... |
|---|---|
|
|
The Request Processing page enables you to monitor the following details:
The average request processing time for both synchronous and asynchronous messages, active requests, requests processed, and faulted requests in the service engines and service infrastructure.
The average request processing time, requests processed, and errors occurring in service (inbound) and reference (outbound) binding components.
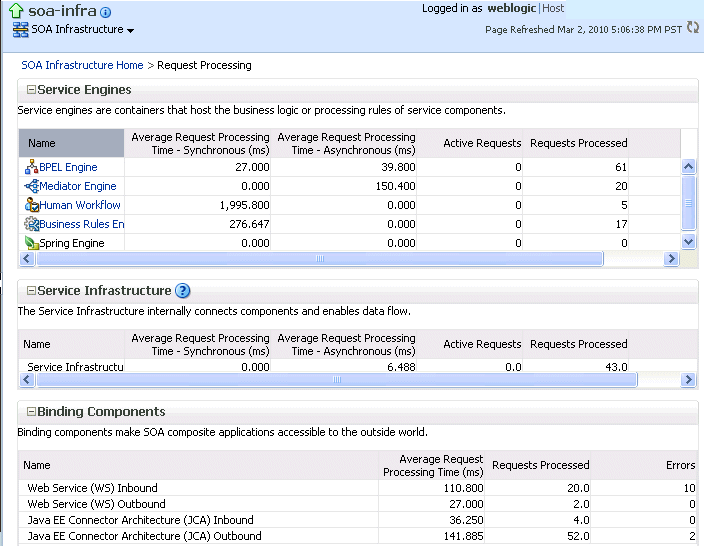
In the Service Engines section, click a specific service engine (for example, BPEL Engine) to access details such as recent instances using this service engine, components using this service engine, and recent fault occurrences.
For more information, see the following sections:
You can monitor all service and reference binding components used in all SOA composite applications deployed to the SOA Infrastructure. Services provide the outside world with an entry point to the SOA composite application. The WSDL file of the service advertises its capabilities to external applications. References enable messages to be sent from the SOA composite application to external services in the outside world.
To monitor service and reference binding components in the SOA Infrastructure:
Access this page through one of the following options:
| From the SOA Infrastructure Menu... | From the SOA Folder in the Navigator... |
|---|---|
|
|
The Services page displays details about the names and types of the services, the SOA composite applications in which the services are used, the partitions in which the SOA composite applications are deployed, the total number of messages processed, the average processing time, and the number of faults occurring in the services.
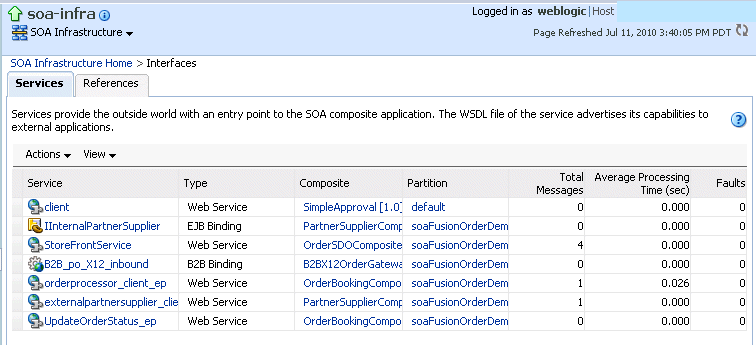
In the Service column, click a specific service to access its home page.
In the Composite column, click a specific SOA composite application to access its home page.
In the Partitions column, click a specific partition to access its home page.
Click the References tab.
The References page displays details about the names and types of the references, the SOA composite applications in which the references are used, the partitions in which the SOA composite applications are deployed, the total number of messages processed, the average processing time, and the number of faults occurring in the references.
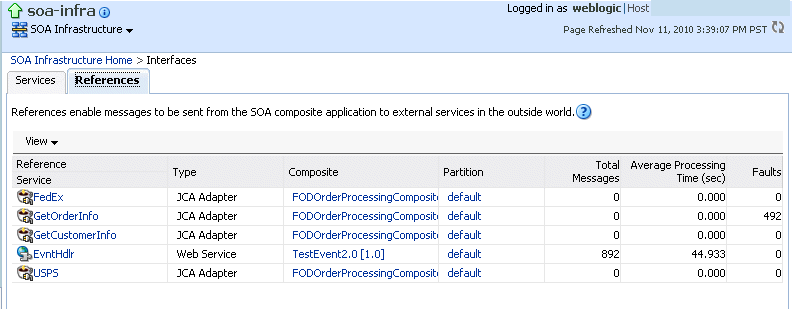
In the Reference column, click a specific reference to access its home page.
In the Composite column, click a specific SOA composite application to access its home page.
In the Partitions column, click a specific partition to access its home page.
For more information about services and references, Section 1.2.5, "Introduction to Binding Components."