| Oracle® Enterprise Manager Cloud Control Basic Installation Guide 12c Release 1 (12.1.0.1) Part Number E22624-12 |
|
|
PDF · Mobi · ePub |
| Oracle® Enterprise Manager Cloud Control Basic Installation Guide 12c Release 1 (12.1.0.1) Part Number E22624-12 |
|
|
PDF · Mobi · ePub |
This chapter describes how you can install JVM Diagnostics (JVMD) in the Enterprise Manager Cloud Control environment.
In particular, this chapter covers the following:
JVM Diagnostics (JVMD) is one of the critical functionalities in Enterprise Manager Cloud Control that enables administrators to diagnose performance problems in Java applications in the production environment. By eliminating the need to reproduce problems, it reduces the time required to resolve these problems thus improving application availability and performance.
Therefore, to manage applications effectively and identify the root cause of performance problems in the production environment without having to reproduce them in the test or development environment, you must deploy JVMD Manager. The JVMD Manager runs as an Enterprise JavaBeans (EJB) Technology on a WebLogic Server.
The JVMD Agent is deployed on the targeted JVM (the one running a production WebLogic Server). It collects real-time data and transmits it to the JVM Diagnostics Manager. This data is stored in the Management Repository, and the collected information is displayed on Enterprise Manager Cloud Control console for monitoring purposes. The communication between the JVMD Manager and the JVMD Agent can be a secure (SSL) or non-secure connection.
To install JVMD, use the Middlware Diagnostics page that is accessible from within Enterprise Manager Cloud Control console. To access the portal, from Setup menu, and then select Middleware Diagnostics.
The Middleware Diagnostics Page is a GUI based screen that enables you to deploy JVMD Manager, and monitor the health of the JVMD Manager application in a reliable and an efficient manner.
Using Middlware Diagnostics Page, you can achieve the following:
Deploy JVM Diagnostics Manager.
Monitor the availability of all the JVMD Managers.
Access information about the JVMD Managers like host to which the managers are deployed, the current status, the port on which they running, version, and so on.
Before you begin installing JVM Diagnostics, keep these points in mind.
For JVMD Manager:
The Weblogic Server on which you want to deploy the JVMD Manager, must be up and running.
JVMD Manager can be deployed only on managed servers that are part of Enterprise Manager Cloud Control domain.
Oracle recommends that you do not deploy other applications to the managed server on which the JVMD Manager is deployed.
For JVMD Agents:
To deploy JVMD Agent, the WebLogic Server hosting the JVMD Manager should be up and running.
Ensure that at least one JVMD Manager up and running in Active state, to deploy a JVMD Agent.
Ensure that you meet the following prerequisites:
For more information about JVMD Manager hardware requirements, refer to "CPU, RAM, Heap Size, and Hard Disk Space Requirements for OMS"
The JDK version required to deploy JVMD Agent is JDK 1.5 or higher
Supported Operating Systems for JVMD Agents are:
Linux x86
Linux x86-64
Windows x86
Windows x86-64
Solaris x86
Solaris x86-64
Solaris SPARC
Solaris SPARC (64 bit)
AIX PowerPC (32 bit)
AIX PowerPC (64 bit)
JRVE
HP IA-64(32 bit)
HP IA-64(64 bit)
HP PA-RISC(32 bit)
This section contains the following topics:
To deploy JVMD Manager on the same host as OMS; automatically creating a managed server, you must log in with SYSMAN account (a default Super Administrators account that is installed with Enterprise Manager), and perform the following steps:
In Cloud Control, from Setup menu, select Middleware Diagnostics. For more information about the Middleware Diagnostic page, see Figure 10-1.
On the Middleware Diagnostics page, click Deploy JVM Diagnostics Manager (JVMD).
On the Deploy JVM Diagnostics page, select Create a managed server, and enter the following details:
Select an OMS Server from the Host list. The list comprises of all the servers present in the Enterprise Manager WebLogic domain.
For example, host1.example.com (EMGC_OMS1),host2.example.com (EMGC_OMS2), and so on.
Enter a unique name for the managed server in the Managed Server Name field.
For example, EMGC_JVMDMANAGER1, EMGC_JVMDMANAGER2,and so on.
The Port numbers for Managed Server Listen Port and Managed Server SSL Listen Port are populated with the default values 3800 and 3801 respectively. You can change these values by entering custom value if required.
Specify the Oracle Management Server Host Credentials and Oracle WebLogic Domain Credentials:
Where,
Oracle Management Server Host Credentials are the credentials for the host machine where the OMS server selected is running. For example, the OMS selected is EMGC_OMS1 (host1.example.com).
Oracle WebLogic Domain Credentials are credentials of the Weblogic domain in the Enterprise Manager Cloud Control.
For more information about credentials, see Selecting Credentials.
Click Deploy to submit the job.
The JVMD Manager Deployment Status page appears with a link to the job status. Click the link to see the status of the job that you submitted.
To deploy JVMD Agents to a WebLogic Server, perform the following steps:
In Cloud Control, from the Targets menu, select Middleware.
The Middleware page displays a list of all the Middleware related targets discovered, and being managed in Cloud Control. Click target name to select the desired target.
From the Middleware page, click Oracle WebLogic Domain. JVMD Agents can be deployed on Enterprise Manager WebLogic domain or other WebLogic Domains too.
All the managed server present in the domain appear in the domain home page.
From the WebLogic Domain menu, select Diagnostics, and then click Setup Diagnostics Agents to deploy agents to the selected managed servers.
On the Deploy Diagnostics Agents page as shown in Figure 10-3, choose the Oracle WebLogic Server (managed servers) to which you want to deploy the JVMD agents.
Ensure that you retain the selection of only those Diagnostic Agent(s) that you want to deploy to each of the managed server, deselect the others.
By default, the following servers appear deselected:
The Administration server is not selected by default.
All the managed servers that are not up and running appear deselected by default.
If the Deployed Version and the Version to Deploy are the same, and the status of the already deployed JVMD agent is up and running.
In the Diagnostics Agent Configuration section, enter the JVMD Configuration Properties for the selected agents.
Select the desired JVMD manager from the JVMD Manager list.
The JVMD agents selected for deployment will report to this JVMD Manager.
If the version of the WebLogic Server is greater than 9.2.X, and if the Management Agent is used to discover the monitored WebLogic domain which is not JRF enabled, then an Additional Configuration section appears.
In the WebLogic Home field, enter the absolute path to the WebLogic home of the monitored domain.
If the WebLogic Middleware Home field appears, then enter the absolute path to the WebLogic Middleware Home of the monitored domain.
In the Credentials section, provide Oracle Weblogic Administration Server Host Credentials , and Oracle WebLogic Domain Credentials.
Where,
Oracle WebLogic Administration Server Host Credentials are credentials for the host where the WebLogic Administration Server is running.
Oracle WebLogic Domain Credentials are credentials of the monitored WebLogic domain in the Enterprise Manager Cloud Control.
For more information, see Selecting Credentials.
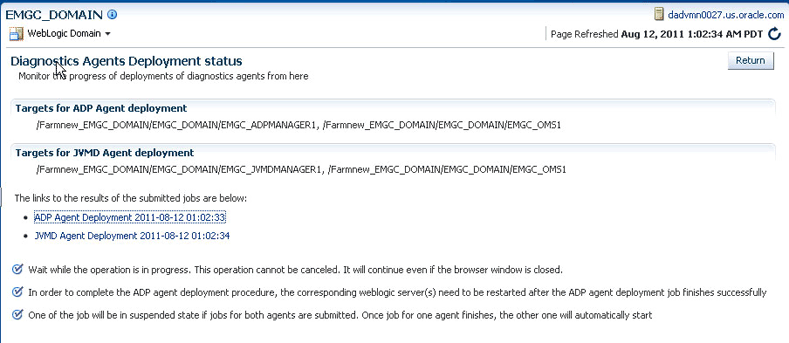
Click Deploy to submit the job. A Diagnostics Agent Deployment status page as follows appears:

The Status page appears with a link to the job status. Click the link to see the status of the job that you submitted.
The section contains the following:
Once you have deployed JVMD manager, you can perform the following sanity checks to verify if the JVMD manager has been installed accurately on the managed server. To monitor the health of the JVM Diagnostics Manager, perform the following steps:
In Cloud Control, from Setup menu, select Middleware Diagnostics.
On the Middleware Diagnostics page, all the deployed Managed Servers are listed. Attributes like Manager Id, Host, Port, SSL Port, Version, Status, Availability, and Server available on the Middleware Diagnostics page helps monitor the status and the availability of the JVMD Manager.
Once you have deployed JVMD Agent, you can perform the following sanity checks to verify if the JVMD Agent is installed on the targeted manager servers accurately:
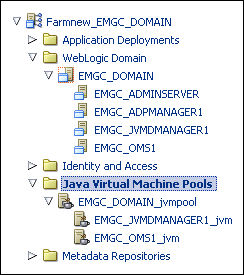
In Cloud Control, from the Targets menu, select Middleware. On the Middleware home page, select the domain where the JVMD agent was deployed. On the left hand pane, from Target Navigation section, click Java Virtual Machine Pools to expand the menu, the JVMD targets appear.

Each of the targets corresponds to one of the managed servers chosen for JVMD agent deployment. All these mentioned targets should be up and running.
Log into the WebLogic Administration console of the domain where the JVMD agent was deployed. The targeted managed servers should have a new application with the name javadiagnosticagent_<managed_server_name>, and this application should up and running.