 Understanding Manufacturing Scorecard
This chapter provides overviews of Manufacturing Scorecard, Manufacturing Scorecard summary, and delivered KPIs, lists prerequisites, and discusses how to:
Set up and use Manufacturing Scorecard.
Define calculations and calculate metrics.
Understanding Manufacturing Scorecard
Today, businesses measure their success based on several key performance indicators (KPIs). A scorecard is an enterprise tool for the evaluation and communication of strategic objectives and these KPIs. The Manufacturing Scorecard implements the SCOR (Supply Chain Operations Reference) model within the Scorecard framework, and enables you to effectively monitor, analyze, and respond to those measures that characterize your manufacturing supply chain performance.
Manufacturing Scorecard works in conjunction with Scorecard to provide a current representation of how your manufacturing organization is meeting its manufacturing-centric objectives. Data flows through Scorecard based on a defined frequency. Transactional data is provided to the PeopleSoft EPM warehouse tables, where it is transformed using the Scorecard analysis tools. The system displays analysis results to users who can use this information to analyze or take actions as necessary. The analysis results are accessed from the company intranet or business home page.
Manufacturing Scorecard enables the alignment of day to day management decisions with the overall corporate strategy by combining best practice key performance indicators to monitor and respond to performance changes in real time. The Manufacturing Scorecard supports the Supply Chain Council's SCOR model. The Manufacturing Scorecard comprises the following metrics:
Measures defined by SCOR
Supplier metrics
Customer metrics
This section discusses:
Integrations
Scorecards and strategy components
KPIs
Batch processes
 Integrations
Manufacturing Scorecard supports the plan, source, make, deliver, and return business processes.
Manufacturing Scorecard data tables reside in PeopleSoft EPM, which serves as a data repository that can include data from other PeopleSoft applications and other legacy systems, enabling you to source the supply chain, supplier, and customer data that you need. Manufacturing Scorecard leverages the functionality of the Scorecard to manage and measure key performance indicators and communicate strategic direction and results to your organization.
Scorecards and Strategy Components
A scorecard is the visual representation of the objectives that your organization is striving to achieve. The scorecard's foundation is a strategy tree that is comprised of hierarchical nodes of strategy components. Manufacturing Scorecard delivers the Manufacturing scorecard (MFG_SCORECARD).
Strategy components are the elements that make up your strategy, and are the nodes on your strategy tree or tables. Vision, strategic thrusts, and critical success factors are all strategy components, and represent the goals that your manufacturing organization is trying to achieve. KPIs, which measure how well an organization is achieving those goals, are attached to scorecard strategy components.
The predefined data components that make up the Manufacturing Scorecard are delivered at installation. After you install the database, setting up and accessing the Manufacturing Scorecard involves setting up PeopleSoft EPM, populating the data warehouse with data, updating several components of the Scorecard, and populating the final reporting tables.
Note. Before you attempt to set up the Manufacturing Scorecard, you should have installed the appropriate components using the installation documentation and moved the appropriate data components to your system database.
The predefined data components, as delivered, are set up to run with a specific business unit, setID, model ID, scenario ID, and so on. All of the appropriate security and object IDs are delivered as sample data. If you install the Manufacturing Scorecard to a demo database, you can acquaint yourself with the functionality in a demo environment. Using the delivered scorecard is optional, and you can modify it to suit your implementation. You can use the KPI Data Migration Utility to customize content for the delivered scorecards.
This table lists the field values for this scorecard:
|
Scorecard ID |
MFG_SCORECARD |
|
SetID |
SHARE |
|
Business Unit |
CORP1 |
|
Scenario ID |
MFG_SC |
|
Model |
MFG |
|
Strategy Tree |
MFG_STRATEGY |
|
Strategy Components |
The strategy components for the operating strategy (strategic thrust) are:
|
KPIs
A KPI defines the data value or calculation from the PeopleSoft EPM warehouse tables that is evaluated to determine how well your organization is meeting its critical success factors.
Manufacturing Scorecard delivers a set of preconfigured KPIs that provides your management with the tools necessary to analyze your manufacturing operation against business objectives. These KPIs have been developed in conjunction with leading consultants and measure many factors including reliability, responsiveness, flexibility, and cost. Most of these KPIs are derived or calculated from existing PeopleSoft EPM data elements based on data from the transactional database.
In cases where data values required for generating the KPIs cannot be derived from PeopleSoft EPM warehouse tables, manual KPIs are provided. Manual KPIs require manual data input.
Manufacturing Scorecard consists of Level 1 KPIs and Level 2 KPIs. Level 1 KPIs are derived from level 2 KPIs. Without level 2 KPIs, level 1 KPIs cannot perform the proper calculations. This dependency is documented in the technical details of the delivered KPIs section in each KPI table.
The KPI IDs of the delivered Manufacturing Scorecard KPIs are delivered under the SHARE setID and are associated with each strategy component as described in this table:
|
Component ID |
Description |
KPI List |
|
MFG_SCOR_RELB |
Improve Reliability |
MFG_SC011 |
|
MFG_SCOR_RESP |
Increase Responsiveness |
MFG_SC021 |
|
MFG_SCOR_FLEX |
Improve Flexibility |
MFG_SC031 |
|
MFG_SCOR_COST |
Reduce Supply Chain Costs |
MFG_SC041 MFG_SC042 MFG_DPO001 MFG_DSO001 |
|
MFG_SCOR_ASSET |
Improve Asset Utilization |
MFG_SC051 MFG_SC052 |
|
MFG_SRS_PERF |
Monitor Supplier Performance |
MFG_SR061 MFG_SR062 MFG_SR063 MFG_SR064 MFG_SR065 |
|
MFG_CUST_SATS |
Improve Customer Satisfaction |
MFG_CS071 MFG_CS072 MFG_CS073 MFG_CS074 |
|
MFG_LEAN_EFF |
Improve Manufacturing Efficiency |
MFG_LMIDD MFG_LMIN MFG_LMIT MFG_LMNP MFG_LMOE MFG_LMP MFG_LMROI MFG_LMT MFG_LMTDD |
Batch Processes
You must run the following jobstreams to populate key tables:
KP_ANALYZE
This jobstream populates KP_KPI_CALC_F00 and KP_KPI_ASMT_F00. Run this jobstream to validate the KPI calculation rules, verify end values, and test the KPI assessment rules.
BC_ANALYZE
This jobstream populates KP_KPI_CALC_F00, KP_KPI_ASMT_F00 and BC_ASSESS_F00. Run this jobstream to generate the final scorecard assessments after you validate your setup (by running KP_ANALYZE). If you set up this job to run regularly, the KPI process can aggregate data month-to-month and year-to-date. You must run this process after you populate or update the PeopleSoft EPM warehouse tables (such as during the Extract Transform and Load process) to view current results for your manufacturing scorecard.
See Also
Processing KPIs and Scorecards
Manufacturing Scorecard Summary
The following table contains a summary of the KPIs that are delivered with Manufacturing Scorecard. It lists the KPI description, dimension or object type, perspective type, and KPI calculation definition.
|
KPI Name |
Dimension (Object Type) |
Perspective |
KPI Calculation |
|
Total Product Revenue |
Business Unit |
Financial |
Calculates the total revenue of all products sold . |
|
Inventory Cost |
Business Unit |
Internal |
Total of all inventory costs. |
|
Supply Chain Cost |
Business Unit |
Internal |
sum of all supply chain related costs / (total product revenue – total product profit) |
|
Supply Chain Adaptation Time |
Business Unit |
Internal |
# days to identify environmental change & devise response + # days to achieve supply of material for new demand level + days to achieve sustained production rate for new demand level + # days to achieve sustained delivery rate at required service levels |
|
Return on Supply Chain Assets |
Business Unit |
Internal |
Supply Chain Revenue Contribution / Supply Chain Fixed Asset Value |
|
Perfect Order Fulfillment |
Business Unit |
Internal |
[total orders shipped on time and in full - orders with faulty documentation - orders with shipping damage] / [total orders] |
|
Order Fulfillment Lead Time (average) |
Business Unit |
Internal |
[actual lead times for orders shipped] / [total number of orders shipped] |
|
Total # of Purchase Orders |
Business Unit |
Internal |
Total number of purchase orders for a period. |
|
Total # of Shipments |
Business Unit |
Internal |
Total # of shipments made for a period. |
|
# Shipments On-Time & Qty Correct |
Business Unit |
Internal |
# shipments made by the commit date with the quantity requested. |
|
Sum of Shipment Lead Times |
Business Unit |
Internal |
Sum difference between shift date and request date. |
|
# of On-Time Shipments |
Business Unit |
Internal |
# shipments made on or before the scheduled date. |
|
# Shipments With Backorder Qty |
Business Unit |
Internal |
# shipments made having a backorder amount. |
|
# Shipments Made In-Full |
Business Unit |
Internal |
# shipments made with the correct requested quantity. |
|
Total # of Orders Received |
Business Unit |
Internal |
Total number of orders received in a period. |
|
# of Orders Invoiced Correctly |
Business Unit |
Internal |
# Orders received with correct invoice amount. |
|
Purchase Qty Accepted |
Business Unit |
Internal |
Sum of QTY_SH_ACCPT_SUOM for all orders received |
|
# Orders Received On-Time |
Business Unit |
Internal |
# of orders received by the promised date |
|
# Orders Received Qty Correct |
Business Unit |
Internal |
# orders received with the correct order quantity |
|
Total Order Qty Received |
Business Unit |
Internal |
Sum of QTY_SH_RECVD_SUOM for all orders received |
|
Total purchase amount |
Business Unit |
Internal |
Sum of MERCH_AMT_BSE for all orders |
|
Purchase amount under contract |
Business Unit |
Internal |
Sum of MERCH_AMT_BSE where CNTRCT_ID is not NULL' |
|
Customer Satisfaction Score |
Business Unit |
Internal |
Average of customer satisfaction scores. |
|
Cost Of Goods Sold |
Business Unit |
Financial |
Resolved using customer-specific PeopleSoft tree structure defining list of General Ledger account groups. |
|
% PO Invoiced Correct |
Business Unit |
Supplier |
(# of purchase orders invoiced correctly / total # purchase orders) * 100 |
|
% Orders Returned |
Business Unit |
Internal |
# orders returned within a period / # orders shipped within same period |
|
% Orders Received On Time |
Business Unit |
Internal |
% of orders received on time. |
|
% Ordered Quantity Correct |
Business Unit |
Internal |
(quantity received correct / total receipt quantity) - (received qty correct / receipts qty shipped) * 100 |
|
% Ordered ($) Under Contract |
Business Unit |
Internal |
(purchased amount under contract / purchased amount closed) * 100 |
|
% On Time Delivery |
Business Unit |
Internal |
# shipments made per commit date / total # shipments made |
|
% Returned |
Business Unit |
Internal |
(# orders returned within a period / # orders shipped within same period) * 100 |
|
Days Payable Outstanding |
Business Unit |
Internal |
Resolved using customer-specific PeopleSoft tree structure defining list of General Ledger account groups. |
|
Days of Inventory Supply |
Business Unit |
Internal |
Current days of inventory supply |
|
Days Sales Outstanding |
Business Unit |
Internal |
Resolved using customer-specific PeopleSoft tree structure defining list of General Ledger account groups. |
|
% Perfect Order Fulfillment |
Business Unit |
Internal |
( (# shipments made on time per a requested date - # shipments having errors ) / total # shipments) * 100 |
|
Sum of Supply Chain Costs |
Business Unit |
Internal |
MFG_CST011 + MFG_CST012 + MFG_CST013 + MFG_CST014 + MFG_CST015 + MFG_CST016 + MFG_CST017 |
|
Cash to Cash Cycle Time |
Business Unit |
Internal |
(total inventory days of supply + days of sales outstanding) - days of payables outstanding |
|
# Shipments Having Errors |
Business Unit |
Internal |
# of instances of product returns for a period |
|
# Returned Orders |
Business Unit |
Internal |
# of instances of product returns for a period |
|
% Receipts Qty Correct |
Business Unit |
Internal |
( MFG_RCV003 / MFG_RCV001 ) * 100 |
|
% Backorders |
Business Unit |
Internal |
# shipments having a backorder qty / total # of shipments made |
|
# of Orders Shipped |
Business Unit |
Internal |
Total # of shipments. |
|
# of Orders Shipped On Time |
Business Unit |
Internal |
# of on-time shipments. |
|
Delivery Performance |
Business Unit |
Internal |
Percent on time delivery. |
|
Average Item Cost (Unit Cost Per Item) |
Business Unit |
Internal |
Sum of (std_cost) / sum of (items) |
|
Average Item Inventory |
Business Unit |
Internal |
Sum of (qty_onhand) / sum of (items) |
|
Average Item Use Per Month |
Business Unit |
Internal |
use_per_year / 12 |
|
Inventory Dollar Days |
Business Unit |
Internal |
unit cost * (average inventory / average use per month) |
|
Investment |
Business Unit |
Internal |
material costs + cost of work in progress + finished goods costs + facilities costs + equipment costs |
|
Raw Material Costs |
Business Unit |
Financial |
Resolved using customer-specific PeopleSoft tree structure defining list of General Ledger account groups. |
|
Work in Progress Cost |
Business Unit |
Internal |
Resolved using customer-specific PeopleSoft tree structure defining list of General Ledger account groups. |
|
Facilities Costs |
Business Unit |
Financial |
Resolved using customer-specific PeopleSoft tree structure defining list of General Ledger account groups. |
|
Equipment Costs |
Business Unit |
Financial |
Resolved using customer-specific PeopleSoft tree structure defining list of General Ledger account groups. |
|
Inventory Turns |
Business Unit |
Internal |
throughput / inventory |
|
Net Profit |
Business Unit |
Internal |
throughput – operating expense |
|
Operating Expense |
Business Unit |
Internal |
throughput – operating expense |
|
Cost of Salary and Wages |
Business Unit |
Internal |
wage costs + cost of benefits + utilities costs + insurance costs + lease expenses + interest + taxes |
|
Cost of Benefits |
Business Unit |
Financial |
Resolved using customer-specific PeopleSoft tree structure defining list of General Ledger account groups. |
|
Cost of Utilities |
Business Unit |
Financial |
Resolved using customer-specific PeopleSoft tree structure defining list of General Ledger account groups. |
|
Insurance Costs |
Business Unit |
Financial |
Resolved using customer-specific PeopleSoft tree structure defining list of General Ledger account groups. |
|
Lease Costs |
Business Unit |
Financial |
Resolved using customer-specific PeopleSoft tree structure defining list of General Ledger account groups. |
|
Interest Costs |
Business Unit |
Financial |
Resolved using customer-specific PeopleSoft tree structure defining list of General Ledger account groups. |
|
Taxes |
Business Unit |
Financial |
Resolved using customer-specific PeopleSoft tree structure defining list of General Ledger account groups. |
|
Productivity |
Business Unit |
Internal |
throughput / operating expense |
|
Return on Investment |
Business Unit |
Internal |
net profit / inventory |
|
Throughput |
Business Unit |
Internal |
total sales – total variable expense |
|
Shipment Days Late |
Business Unit |
Internal |
Sum of (ship_date – request_date) |
|
Shipment Value |
Business Unit |
Internal |
Sum of (unit_price * ship_qty) |
|
Throughput Dollar Days |
Business Unit |
Internal |
shipment days late * shipment value |
|
Total Variable Expense |
Business Unit |
Internal |
material cost + sales commissions + shipping costs + packaging costs |
|
Material Costs |
Business Unit |
Financial |
Resolved using customer-specific PeopleSoft tree structure defining list of General Ledger account groups. |
|
Sales Commissions |
Business Unit |
Financial |
Resolved using customer-specific PeopleSoft tree structure defining list of General Ledger account groups. |
|
Shipping Costs |
Business Unit |
Financial |
Resolved using customer-specific PeopleSoft tree structure defining list of General Ledger account groups. |
|
Packaging Costs |
Business Unit |
Financial |
Resolved using customer-specific PeopleSoft tree structure defining list of General Ledger account groups. |
|
Respond To Environment Change |
Business Unit |
Internal |
#days to identify environmental change and devise response + # days to achieve supply of material for new demand level + days to achieve sustained make rate for new demand level + # days to achieve sustained delivery rate at required service levels. |
|
Achieve New Material Supply |
Business Unit |
Internal |
# days required to achieve a new material supply schedule. |
|
Achieve New Production Rate |
Business Unit |
Internal |
# days required to implement a new production rate. |
|
Achieve New Delivery Rate |
Business Unit |
Internal |
# days required to achieve a new delivery rate. |
|
Order Management Costs |
Business Unit |
Internal |
Costs associated with order processing. |
|
Procurement Costs |
Business Unit |
Internal |
Costs associated with purchasing and procurement. |
|
Planning Costs |
Business Unit |
Internal |
Costs associated with planning activities. |
|
MIS Costs |
Business Unit |
Internal |
Costs associated with operating MIS operations. |
|
Warranty Costs |
Business Unit |
Internal |
Costs associated with warranty replacements. |
|
Returned Product Costs |
Business Unit |
Internal |
Costs associated with processing returned goods. |
|
Total Product Profit |
Business Unit |
Internal |
Resolved using customer-specific PeopleSoft tree structure defining list of General Ledger account groups. |
|
Supply Chain Fixed Asset Value |
Business Unit |
Internal |
(Supply chain revenue contribution / supply chain fixed asset value) * 100. |
Delivered KPIsDetails about the delivered KPIs are provided in the MFGPIS.PDF file that is located on the PeopleBooks CD. This file provides information on each of the delivered predefined KPIs via summary and detail tables. Use these tables to better understand Manufacturing Scorecard calculations. You can also use the information in these tables as a basis for altering the scorecard to update KPIs and target rules.
Setting Up and Using Manufacturing Scorecard
To use Manufacturing Scorecard perform the following tasks:
Set up PeopleSoft EPM warehouse tables.
Define PeopleSoft EPM components including business rules, general options, business units, business models, scenarios, security, ledgers and templates, tablemaps, datamaps, filters, and constraints.
Extract, transform, and load data from source tables into the Operational Warehouse Staging tables.
Review data warehouse tables delivered with the system.
Run ETL to populate the data warehouse tables.
Set up Scorecard tables (optional).
You are not required to set up these tables to implement Manufacturing Scorecard if you plan to use only the delivered Manufacturing Scorecard KPIs. The metadata for these KPIs is also delivered; it is in the SHARE setID. However, if you plan to establish your own scorecards or KPIs, you will need to establish these tables.
Define your strategy, which includes creating strategy trees and strategy components; setting up strategy components and specifying their assessment method, and creating the scorecard definition.
Prepare data required for KPIs which includes these tasks: define the data from the Enterprise Warehouse that is the basis for your data elements (data elements are used by KPIs to measure actual results); create calculation definitions on which to base a KPI; specify what type of activity should occur as a result of KPI assessment; establish actions to take as a result of KPI assessment (actions are made up of one or more activities); establish assessment definitions—that is, when the target rule that uses this assessment evaluates as true, the image assigned appears on the scorecard.
Define KPIs, including calculation and assessment frequency, attachments, analysis paths, report attributes, and notes.
Establish the security groups for viewing KPIs and for KPI assessment.
Define assessments.
Define summary calendars.
If you use default targets for any KPI dimension members, enter those values.
Set up user profiles.
Set up Manufacturing Scorecard.
Define calculations.
Define parameters for calculating metrics.
Defining Calculations and Calculating Metrics
This section provides an overview of Manufacturing Scorecard calculations and discusses how to:
Define data elements and calculations.
Calculate metrics.
Review metrics.
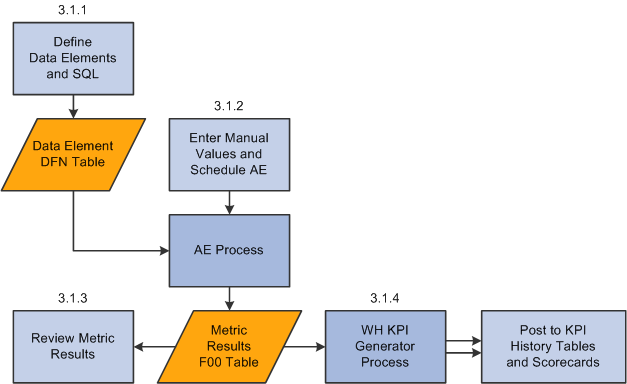
Understanding Manufacturing Scorecard CalculationsThe Manufacturing Scorecard, provides you with the ability to manage the metrics that formulate the KPIs. Here you can define the root data element values and the associated SQL, financial data, or manual input used to extract the metrics from PeopleSoft EPM. Doing so allows you to easily configure the metric derivations without having to navigate through all of the PeopleSoft EPM and KPI configuration pages.
You can use the Define Calculations component to define the data element IDs that are used to calculated the scorecard metrics. The configuration settings are stored in the MFG_KPIVAL_DFN table. They are keyed by data element ID and are global to PeopleSoft EPM (that is, they are not keyed by setID or business unit).
You then request the system to calculate the metrics for a specific business unit and fiscal period. The system reads the data element definitions from the MFG_KPIVAL_DFN table and allows you to override any manual KPI values. You schedule the Calculate Manufacturing KPI Metrics (MFG_KPI_CALC) application engine. This engine reads the data element definitions and carries out the specific logic to resolve metric calculations. The engine carries out the logic for each data element defined for the Manufacturing Scorecard and writes the results along with any manual KPI entries to the MFG metric F00 table (MFG_KPIVAL_F00). The results are keyed by business unit and transaction date such that the PF KPI Generator process can select data values using the standard Enterprise Scorecard assessment logic.
You can review the results for any fiscal period from the MFG_KPIVAL_F00 table.
The PF KPI Generator process refers to the MFG_KPIVAL_F00 table to resolve the final KPI calculations and post to the scorecard.
The following graphic illustrates the calculation process flow, from defining data elements through posting to KPI history tables and scorecards:
Pages Used to Define
Calculations and Calculate Manufacturing Scorecard Metrics
|
Page Name |
Definition Name |
Navigation |
Usage |
|
Define Calculations |
MFG_KPIVAL_DFN |
Scorecards, Industry-Specific Processing, Mfg Scorecard Calculations, Define Calculations |
Identify data element IDs that are used to calculate Manufacturing Scorecard KPIs, and associate an existing SQL object to perform the calculation. |
|
Calculate Metrics |
RUN_MFG_KPI_JOB |
Scorecards, Industry-Specific Processing, Mfg Scorecard Calculations, Calculate Metrics |
Enter any manual KPI value overrides and schedule the Calculate MFG Metrics (MFG_KPI_CALC) Application Engine process. This process calculates period-based metric values. The process performs calculations according to the metric definitions that are specified on the Define Calculations page. |
|
Review Metrics |
MFG_KPIVAL_RVW |
Scorecards, Industry-Specific Processing, Mfg Scorecard Calculations, Review Metrics |
Review and confirm the calculated results for a specific fiscal period and year. |
Defining Data Elements and CalculationsAccess the Define Calculations page (Scorecards, Industry-Specific Processing, Mfg Scorecard Calculations, Define Calculations).
You can use this page to maintain calculations values as well as to add metrics.
Data Element Tab
|
Data Element ID |
Lists the data element ID from the KP_DATAELEM_DEFN table. |
|
Metric Type |
Indicates the metric type of Manual, Financial, or resolved using SQL. Financial designates the calculation of financial general ledger-based metrics. For this metric type, you use trees to specify the specific account for the calculations on the Metric Details tab. |
|
SQL Object ID |
For metric types of SQL (prompted) and Financial (display only - MFG_FIN001 is always used), displays the SQL object ID that is used to perform database selection and calculation. |
|
Default Value |
For a metric type of Manual, use to enter a default metric value. Note. The default value can be overridden at calculation time. |
Metric Details Tab
|
SetID and Tree |
For a metric type of Financial, specify the setID and tree that contains the account group structure. |
|
Node |
For a metric type of Financial, specify the tree node that contains the account values. Note. Each account value and/or range of account values contained in the selected node (and any child nodes) will be used at calculation time in order to determine the correct general ledger F00 table data to extract and use in the metric. |
|
|
Click the Select Tree Node button to access the Tree Viewer page, on which you can select the specific account that you want to use by expanding the folders of the tree, highlighting the account, and clicking the Select button. The account appears in the Node field on the Define Calculations page. |
Calculating Metrics
Access the Calculate Metrics page (Scorecards, Industry-Specific Processing, Mfg Scorecard Calculations, Calculate Metrics).
|
Description and Business Unit |
Enter a description and select the performance business unit to which the KPI results resolves. |
|
Fiscal Year and Accounting Period |
Specify the fiscal year and period for the metric calculation. |
|
Review/Change Manual Values |
Use the Review/Change Manual Values group box to review the current values for the manual KPIs. These are initially set on the Define Calculations page. You can override any value before calculating by setting the value type to Override and entering a new value in the Value field. You can also specify No Value for a metric. Doing so cancels the assessment of any KPI that is based on that metric. |
After you have completed any manual value override setup, click the Run button to schedule the MFG_KPI_CALC application engine process. This process reads the data element definitions and carries out the SQL to resolve metric calculations. The engine writes the results to the MFG_KPIVAL_F00 table, where they are picked up by the BC_Analyze process.
Reviewing Metrics
Access the Review Metrics page (Scorecards, Industry-Specific Processing, Mfg Scorecard Calculations, Review Metrics).
Specify the fiscal year and accounting period for which you want to review the results.
|
Calendar ID |
Displays the ID of the calendar associated with the selected business unit. |
|
Date From and Date To |
Displays the date range of the fiscal period (based on the calendar ID used). |
|
Calculation Date |
Displays the date and time that the calculation was performed. |
|
Data element ID and Description |
Displays the ID and description of the data elements that were included in the calculation. |
|
Value |
Displays the value of the metric. For manual KPIs this is the manual value entered. For calculated KPIs, this is the calculated value. |
|
Value Type |
Displays the value type. Possible types are: Default (default manual value), No Value (no value was entered for a manual metric), Error (an error occurred during calculation), and Calculated. |
|
Metric Type |
Displays the metric type. Possible types are: Manual (manual KPIs), Financial (KPIs that are derived from financial general ledger data), and SQL (SQL derived KPIs). |
Note. This is a display-only page. To make corrections, rerun the Calculate KPI application engine for the fiscal year and period.