 DataStage Director Overview
This chapter provides an overview of DataStage Director and discusses how to:
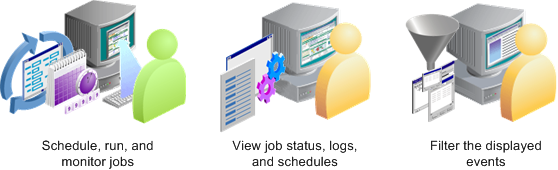
View Job Status
Schedule Jobs
Run Jobs
Monitor Jobs
Review Job Events
Note. This chapter does not discuss all the features available for DataStage Director. For a complete view of DataStage Designer functionality, please see the delivered IBM WebSphere documentation.
DataStage Director Overview
DataStage Director enables you to:
DataStage Director Properties
The DataStage Director window is divided into two panes:
The Job Category pane lists all of the jobs in the repository.
The right pane shows one of three views: Status view, Schedule view, or Log view.
 DataStage Director Menu Options
This table describes DataStage Director menu options:
|
Menu Option |
Description |
|
Project |
Open another project, print, or exit. |
|
View |
Display or hide the toolbar, status bar, buttons, or job category pane, specify sorting order, change views, filter entries, show more details, or refresh the screen. |
|
Search |
Start a text search dialog box. |
|
Job |
Validate, run, schedule, stop, or reset a job, purge old entries from the job log file, delete unwanted jobs, clean up job resources (if this is enabled), set default job parameter values. |
|
Tools |
Monitor running jobs, manage job batches, start the DataStage Designer. |
|
Help |
Displays online help. |
DataStage Director Toolbar OptionsThe following buttons appear on the DataStage Director toolbar:
This table describes the buttons provided with the DataStage Director toolbar
|
Toolbar Button |
Description |
|
Open |
Open a project. |
|
|
Print the current list or log. |
|
Status |
Select the Job Status view. |
|
Schedule |
Select the Schedule view. |
|
Log |
Select the Job Log view. |
|
Find |
Search for a job. |
|
Ascending |
Sort the list in ascending order. |
|
Descending |
Sort the list in descending order. |
|
Run Now |
Run the currently selected job. |
|
Stop |
Stop the job run. |
|
Reset |
Reset the job and cancel any changes to the target. |
|
Add to Schedule |
Add a job to the schedule. |
|
Reschedule |
Change the job schedule. |
|
Help |
View online help. |
DataStage Director View OptionsDataStage Director has three view options:
The Status view displays the status, date and time started, elapsed time, and other run information about each job in the selected repository category.
The Schedule view displays job scheduling details.
The Log view displays all of the events for a particular run of a job.
Viewing Job Status
The Job Status view in DataStage Director can display these possible states:
Compiled: The job has been compiled, but not run since compilation.
Not compiled: The job has not compiled successfully.
Running: The job is currently running.
Finished: The job has finished running.
Finished (see log): The job has finished, but there are warning messages or rows were rejected.
Stopped: The job was stopped by the operator.
Aborted: The job finished prematurely.
Validated OK: The job has been validated with no errors.
Scheduling Jobs
You can schedule a job to run in a number of ways:
Once today at a specified time.
Once tomorrow at a specified time.
On a specific day and at a particular time.
On the next occurrence of a particular date and time.
Daily at a particular time.
To schedule a job In DataStage Director, select the Schedule button from the toolbar.
You can schedule each job to run on any number of occasions using different job parameters, if necessary.
Note. Microsoft Windows restricts job scheduling to administrators. You need to be logged in as an administrator to use the DataStage scheduling features.
Running Jobs
Each time that you run or schedule a job, you can:
Change the job parameters and parameter values that are associated with the job.
Override default limits for row processing and warning messages that are set for the job run.
Set tracing options.
You set job options in the Job Run Options dialog box. They appear automatically when you start to run or schedule a job.
Setting ParametersYou can use the default parameter values, or enter another value. To reinstate the default values, click the Set to Defaultor All to Default button. Some job parameters, like dates, may be variables that you must enter for each job run.
If no parameters are set for a job, the system does not display the Parameters tab.
Setting LimitsSelect the Limits tab to override any default limits for row processing and warning messages that are set for the job run. Click the Validate button to test the new settings or click the Run button to run the job.
Setting TracingTracing helps analysts troubleshoot jobs. You can generate tracing information and performance statistics for server jobs.
The options on this page determine the amount of diagnostic information that is generated the next time a job is run. Diagnostic information is generated only for the active stages in a chosen job.
When the job runs, a file is created for each active stage in the job. The files are named using the format jobname.stagename.trace, and are stored in the &PH& subdirectory of your DataStage server installation directory.
Running, Stopping, Resetting, and Deleting JobsTo run a job, select Job, Run Now, or click the Run button on the toolbar.
You can stop or reset a job. If a job is stopped or aborted, it might be difficult to trace where it ended. By resetting a job, you set it back to a state that can be run and, optionally, return your target files to their original state. If a job has aborted, it must be reset before you can run it again.
You can remove old or unwanted jobs from your project from either the Director or Designer.
Monitoring Jobs
Job monitoring enables you to review job progress through the links and to see the number of rows that are being processed.
To monitor a job In DataStage Director, select a job and then select Tools, New Monitor:
The Monitor window displays summary information about relevant stages in a job. It contains a tree structure that displays stages in a job and their associated links. For server jobs, it shows active stages. Active stages perform processing rather than reading or writing to a data source.
The Link type column displays up to four types of links:
|
Link Type |
Description |
|
<<Pri |
Primary link |
|
<<Ref |
Reference link |
|
<<Out |
Output link |
|
<<Rej |
Reject link |
To see detailed information, double-click a link.
Setting the Refresh Interval
The Monitor window display is updated with new information from the server at regular intervals. You can set how often the updates occur by specifying a time, in seconds, in the Interval field. Click the arrow buttons to increase or decrease the value, or enter the value directly. The default setting is 10. The minimum value is 5. The maximum value is 65.
Reviewing Job Events
DataStage Director enables you to:
DataStage Director - Reviewing Job Events
You can filter:
Jobs that appear in the Job Status view.
Events that appear in the Job Log view.
Filtering Jobs
To filter jobs In DataStage Director, select View, Status, and then View Filter Entries.
This table describes job filtering options:
|
Window Element |
Description |
|
Include |
Specify which jobs to include. Your choices are:
|
|
Exclude |
Specify which jobs to exclude. Your choices are:
|
|
Job Status |
Your choices are:
|
|
Released jobs |
Include only released jobs. |
Filtering Events
To organize log event details, you can filter events to select which log events are displayed, based on age, date/time, or event type. You can also specify the maximum number of entries that will appear.
To filter events In DataStage Director, select View, Log, then View, Filter Entries.
This table describes the events filtering options:
|
Window Element |
Description |
|
From: |
Defines the earliest event to include:
|
|
Through |
Defines the most recent event to include:
|
|
Limit |
Limit the number of events that are displayed:
|
|
Type |
Select one or more types of events that the system will display:
|
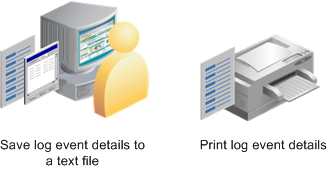
Printing Jobs
To print jobs in DataStage Director, select Project, Print.
You can send the event log details either to your printer or to a text file.
Managing Aborted and Failed Jobs
This section provides information on how you can manage aborted and failed jobs and discusses how to:
Review the job log to determine job errors.
Debug aborted and failed jobs.
Reviewing the Job Log to Determine Job ErrorsThe first step in managing aborted or failed jobs is to use DataStage Director to review the job log, which provides job run information.
Using the job log you can first determine which jobs require your attention. Note that the job log displays which jobs aborted or failed.
Jobs status are color-coded as follows:
Green (V): Informational. Success condition.
Yellow (I): Failed with warnings.
Red (X): Error messages.
You can double-click an aborted or failed job to view details about the job.
A common cause for jobs aborting is that dependent hash files do not exist. This happens when a hash file that a job performs a lookup on has not been pre-created. The hash file load jobs have to be run. As you can see in the screen above, event details suggest that the job is missing the hash file HASH_PS_ADDRESSES_LOOKUP, which is required.
Debugging Aborted and Failed JobsOnce you know which job has an issue, you can access the job in DataStage Designer and view the job with performance statistics on. This shows successful links in green and failed links in red, and helps target the specific part of the job design that failed. The performance statistics also gives the number of rows that have been transmitted through each link, again which information can be useful for debugging a job. Datastage Designer also provides advanced debugging features that can help developers set break points and watch variable values.
Jobs that run with more than on array size or transaction size usually result in a warning message; the job log displays a warning message relevant to each row of data in some instances. For example, if a job has a right string truncated error when inserting into the target database, the log specifically provides the row data that failed.
To address this type of issue, configure the job to limit the rows to process so there are less rows processed during job execution. This restricts the job run time and the log will also be smaller and more manageable.