The Integrator has an easy-to-use interface that lets you quickly create the graphs for loading and updating your data.
A graph is essentially a pipeline of components that processes the data. The simplest graph has one Reader component to read in the source data and one of the Information Discovery components to write (send) the data to the Endeca data store. More complex graphs will use additional components, such as Transformer and Joiner components.
The Integrator, with its powerful graphical interface, provides an easy way to graphically lay out even complex graphs. You drag and drop the components from the Palette and then configure them by clicking on the component icon.
The Integrator perspective consists of four panes and the Palette tool, as shown in this example:
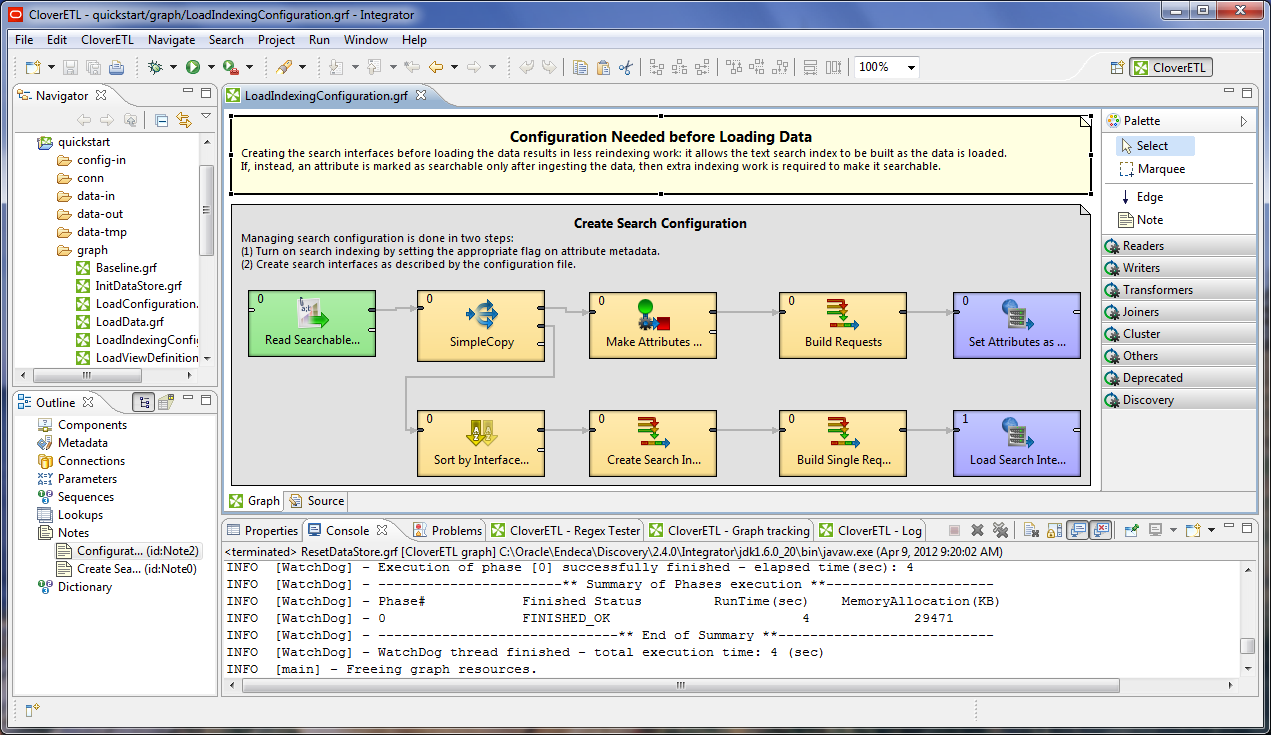
- The Navigator pane lists your projects, their folders (including the graph folders), and files.
- The Outline pane lists all the components of the selected graph.
- The Tab pane consists of a series of tabs (such as the Properties tab and the Console tab) that provide information about the components and the results of graph executions. The illustration shows the Log tab listing the output of a successful record loading operation.
- The Graph Editor pane lets you create a graph and configure its components.
- The Palette lets you select a component and drag it to the Graph Editor.
For more information on the Integrator user interface, see the Oracle Endeca Information Discovery Integrator Guide.
