For each chart, you can configure the order in which to display the group dimension values on the category axis.
To configure the chart sorting:
- On the Chart Configuration tab, click the Configure Sorting button.
-
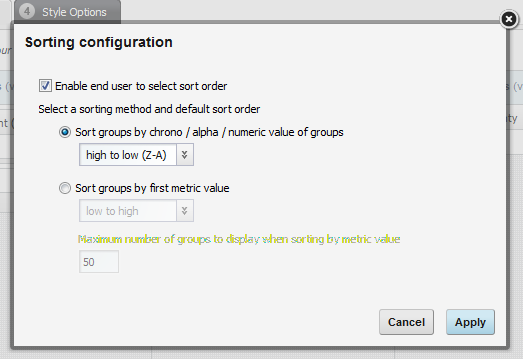
To allow end users to select the sort order, check the
Enable end user to select sort order checkbox.
If this checkbox is checked, then on the end user view, a drop-down list is displayed on the chart to allow end users to change the sort order.
-
Click the radio button next to the method to use to sort the chart
values:
- To use the group
dimension values for the sorting, click the
Sort groups by chrono / alpha / numeric value of
groups radio button.
From the sort order drop-down list, select whether to display the group dimension values alphabetically from low to high (A-Z) or high to low (Z-A).
- To sort the group
dimension values based on the value of the first metric, click the
Sort groups by first metric value radio
button.
From the sort order drop-down list, select whether to display the dimension values in order from lowest to highest metric value, or from highest to lowest metric value.
For example, for the following values:
Group Dimension Value First Metric Value United States 45 France 30 Spain 25 Germany 50 If the chart is sorted by the group dimension value alphabetically from A to Z, the order would be France, Germany, Spain, and then United States.
If the chart is sorted by the first metric value from low to high, the order would be Spain, France, United States, and then Germany.
- To use the group
dimension values for the sorting, click the
Sort groups by chrono / alpha / numeric value of
groups radio button.
-
If you are sorting by the first metric value, then you also can
configure the chart to only display a restricted number of values. In the
Maximum number of groups to display when sorting by metric
value field, type the number of values to display.
In this case, the end user sorting drop-down list includes the number of values.
- To save the sort configuration, click Apply.
