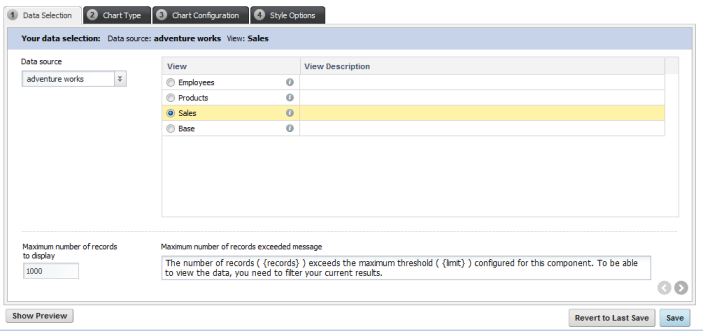
On the Data Selection tab, you select the data source and view to use for the chart. You also determine the maximum number of records to display on the chart.
To select the data source and view:
-
From the
Data source drop-down list, select the data
source you want to use.
The list of views is updated to display the available views for the selected data source.
- To display the available metrics and dimensions for a view, click the information icon next to the view name.
-
To select a view to use, click the radio button next to the view.
If you had already configured the chart, then when you select a different data source, you are prompted to select whether to try to maintain the existing configuration with the new data.
-
In the
Maximum number of records to display field,
type the maximum number of records to display on the chart.
If the number is greater than this value, then the chart is not displayed, and an error message is displayed to the end user.
- In the Maximum number of records exceeded message field, type the message to display when the number of records to process is greater than the number you specified.
