You use the Chart Configuration tab to select the available series metrics, group dimensions, and, if applicable, series dimensions.
The available options are based on the chart type:
| Bar and Line/Area | Bar and Line/Area charts can display
multiple metrics at the same time.
Each option in the end user Metric drop-down list contains one or more metrics. Bar and Line/Area charts also support series dimensions. 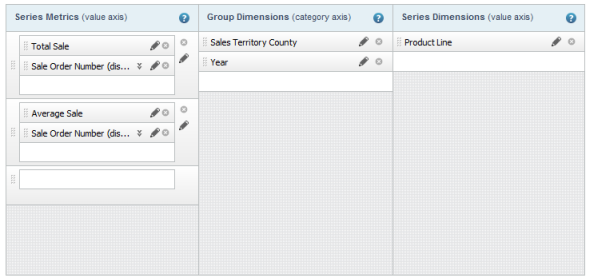 |
| Bar-Line | Bar-Line charts can display multiple bar
and line metrics at the same time.
Each option in the end user Metric drop-down list contains one or more bar metrics and one or more line metrics. Bar-Line charts do not support series dimensions. 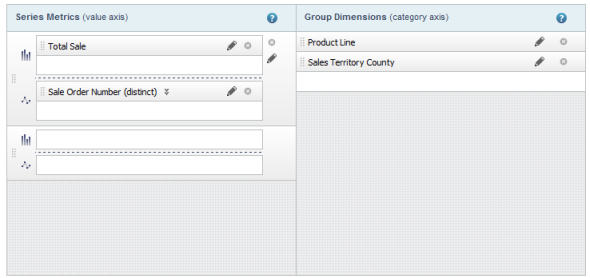 |
| Pie | Pie charts can display one metric at a
time.
Pie charts do not support series dimensions. 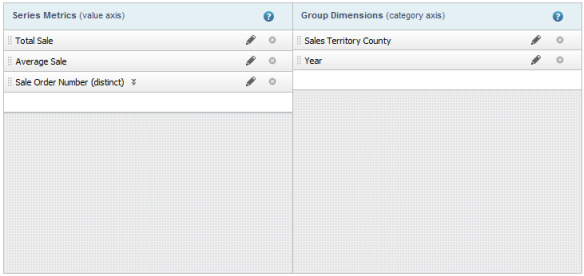 |
The available metrics are listed on the Metrics tab.
The available group and series dimensions are listed on the Dimensions tab.
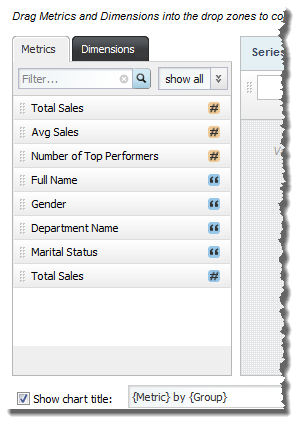
Some of the metrics are predefined, meaning that they have a built-in aggregation method that you cannot change.
If the metric is not predefined, then when you add it to the chart, a default aggregation method is assigned. The default display name for the metric is then the name of the attribute followed in parentheses by the aggregation method. For example, Sales (sum). You can then select a different aggregation method.
Each item in the Metrics and Dimensions lists uses an icon to indicate the data type and, for metrics, whether the metric is predefined.
On the Chart Configuration tab, to select the available metrics, group dimensions, and series dimensions for a chart:
-
In the
Series Metrics list:
-
To add a metric, drag the metric from the
Metrics tab, and then drop it into an
empty slot.
You can use the filter field or the data type drop-down list on the Metrics tab to find a specific metric.
When you populate a slot in a metric group, a new empty slot is added to the group. If needed, a new empty metric group is added to the Series Metrics list.
For pie charts, which only display one metric at a time, when you add a metric to the list, a new empty slot is added to the list.
-
To control the order of the metric groups in the end user
drop-down list, drag each metric group to the appropriate location in the list.
The metric group at the top of the list is selected by default when the chart is first displayed.
-
To control the order of the metrics, drag and drop each metric
to the appropriate location.
The metric at the top of a metric group is displayed first on the chart. For example, for a vertical bar chart, the metric at the top of the group is the first bar displayed for each group dimension value.
For pie charts, the metric at the top of the list is selected by default when the chart is first displayed.
- To remove a metric, click its delete icon.
- To remove a metric group, click its delete icon.
-
To add a metric, drag the metric from the
Metrics tab, and then drop it into an
empty slot.
-
In the
Group Dimensions list:
-
To add a group dimension to the list, drag a dimension from
the
Dimensions tab, and then drop it into the
empty
Group Dimensions slot.
You can use the filter field and data type drop-down list on the Dimensions tab to find a specific dimension.
When you add a group dimension, a new empty slot is added to the list.
-
To control the order in which to display the available group
dimensions in the end user drop-down list, drag and drop each group dimension
to the appropriate location in the list.
The dimension at the top of the list is selected by default when the chart is first displayed.
- To remove a group dimension from the Group Dimensions list, click its delete icon.
-
To add a group dimension to the list, drag a dimension from
the
Dimensions tab, and then drop it into the
empty
Group Dimensions slot.
-
In the
Series Dimensions list:
-
To add a series dimension, drag a dimension from the
Dimensions tab, and then drop it into the
empty series dimension slot.
You can use the filter field and data type drop-down list on the Dimensions tab to find a specific dimension.
When you add a series dimension, a new empty slot is added to the list.
-
To control the order in which the series dimensions display in
the end user drop-down list, drag each dimension to the appropriate location in
the list.
The series dimension at the top of the list is selected by default when the chart is first displayed.
- To remove a series dimension from the list, click its delete icon.
-
To add a series dimension, drag a dimension from the
Dimensions tab, and then drop it into the
empty series dimension slot.
