You use the Configuration tab of the Cross Tab edit view to set up the initial layout of the table, and to format the metrics and dimensions.
The Configuration tab also includes options to configure whether end users can change the configuration, and whether to display summary rows and columns.
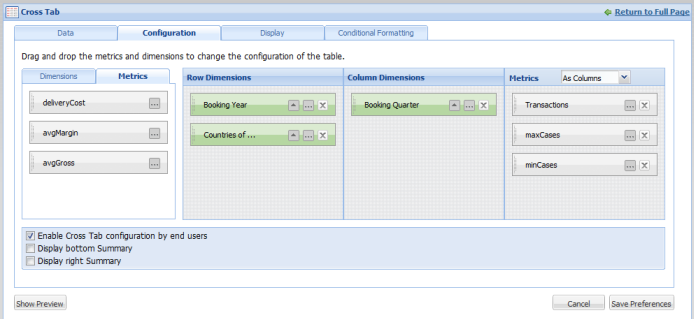
The tabbed list at the left contains the dimensions and metrics that have not been added to the Cross Tab configuration.
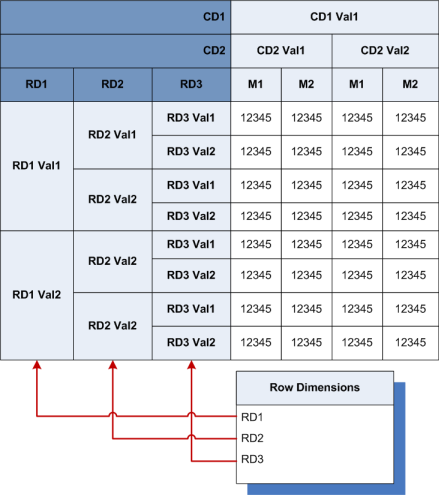
The Row Dimensions list contains the dimensions for which the values are displayed as the header columns to the left of the table.
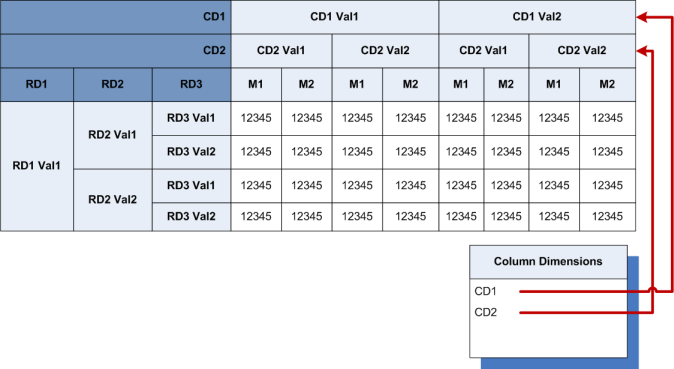
The Column Dimensions list contains the dimensions for which the values are displayed as header rows across the top of the table.
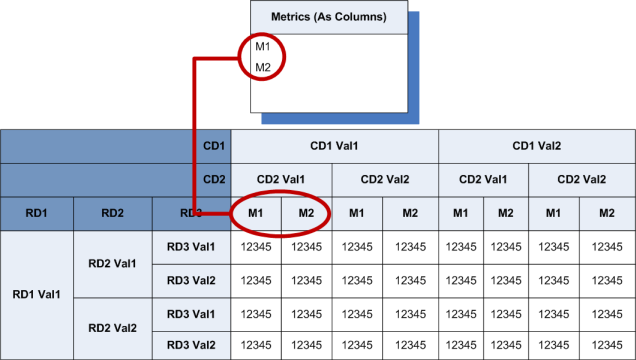
- As columns, with the
labels in the bottom header row on the table (below the column dimensions)
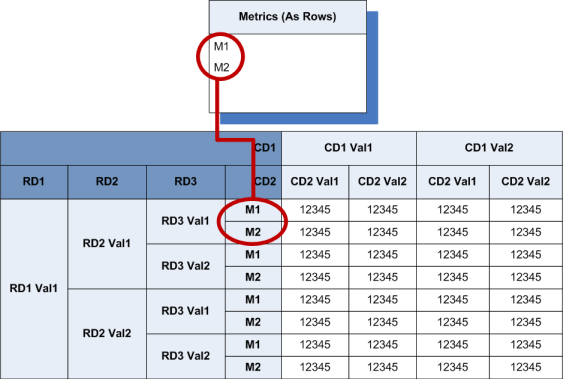
- As rows, with the labels
in the right most header column (after the row dimensions)
To configure the layout of the Cross Tab table:
- To add a dimension from the Dimensions tab to the Cross Tab display, drag the dimension to the Row Dimensions or Column Dimensions list.
-
To determine the order in which the dimensions are displayed in
the row or column dimensions, drag each dimension to its new location in the
list.
- For row dimensions, the dimension at the top of the list is displayed at the far left.
- For column dimensions, the dimension at the top of the list is displayed at the top.
-
To configure each dimension:
- Click the edit icon for the dimension.
-
On the
Configure Dimension dialog, in the
Dimension display name field, type the
name to display for the dimension heading.
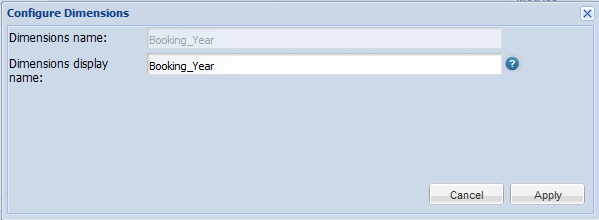
- To save the dimension configuration, click Apply.
-
To add a metric from the
Metrics tab to the
Cross Tab display, drag the metric to the
Metrics list.
To determine the order in which the metric are displayed, drag each metric to its new location in the list.
You use the drop-down list in the list heading to determine how to display the metrics.- To display the metrics as rows, select As Rows.
- To display the metrics as columns, select As Columns.
-
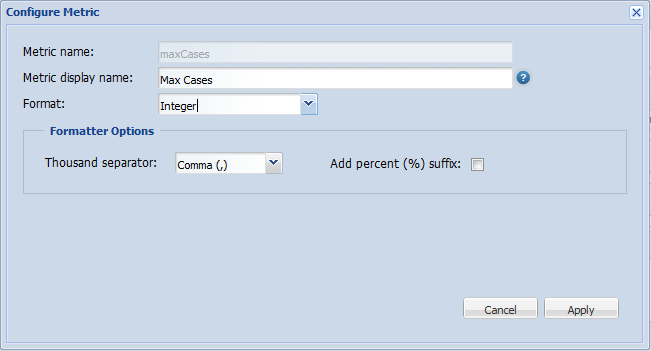
To configure the metric display:
- Click the edit icon for the metric.
-
On the
Configure Metric dialog, in the
Metric display name field, type the row or
column label to display for the metric.
-
From the
Format drop-down list, select the format
in which to display the metric values.
For more information on the formats and their available configuration options, see Formatting values displayed on a component.
- To save the metric configuration, click Apply.
-
To determine the order in which to display the values for a
specific dimension or metric, click the arrow icon.
If the arrow is pointing up, then the values are displayed in ascending order.
If the arrow is pointing down, then the values are displayed in descending order.
-
To remove a metric or dimension from the display, click the delete
icon.
The metric or dimension is returned to the Metrics or Dimensions tab at the left.
- To allow end users to change the layout of the Cross Tab, check the Enable Cross Tab configuration by end users checkbox.
-
To display a row at the bottom of the table showing the summary
for each column, check the
Display bottom Summary checkbox.
Each cell in the summary row uses the same aggregation method as the corresponding column. For example, if a column contains the average of the metric values for each dimension value, then the summary contains the average of all of the values.
-
To display a column at the right of the table showing the summary
for each row, check the
Display right Summary checkbox.
Each cell in the summary column uses the same aggregation method as the corresponding row. For example, if a row contains the average of the metric values for each dimension value, then the summary contains the average of all of the values.
