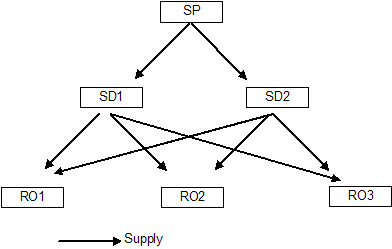
The supply chain illustrated here is simplified. It consists of one refinery (SP), two supply depots (SD), and three retail outlets (RO).
A weekly snapshot of this supply chain is as follows:
The refinery produces a variable amount of gasoline every week, which it transports to SDs for cross-docking.
SDs supply gasoline to ROs, which realize stochastic demand from end customers.
All three supply chain levels (Refinery, SD, and RO) face inventory holding costs.
In addition, the RO's face the risk of stockouts for not fulfilling customer demands.
The problem is to determine the amount of gasoline to transport between each level of the supply chain to minimize the total operating cost, which is computed as the sum of transportation costs and inventory holding costs. For business reasons, it is helpful to minimize stockouts at the ROs, to a certain extent.
The following is a schematic diagram of the supply chain:
Assumptions about the supply chain are as follows:
The weekly supply of gasoline from the refinery (SP) follows a normal distribution with a mean of 2000 gallons and standard deviation (s.d.) of 450 gallons.
The weekly demands at ROs are distributed lognormally with means and standard deviations of 400 gallons and 50 gallons, 500 gallons and 75 gallons, 650 gallons and 100 gallons respectively at RO1, RO2, RO3.
The inventory holding cost is a dollar for every five gallons.
The transportation costs in dollars per gallon are as follows (note that these costs include transportation distances):
Existing inventories in gallons are:
Refinery: 200 gallons, SD1: 50 gallons, SD2: 100 gallons, RO1: 120 gallons, RO2: 180 gallons, RO3: 80 gallons.
