Multiple linear regression is used for data where one data series (the dependent variable) is a function of, or depends on, other data series (the independent variables). For example, the yield of a lettuce crop depends on the amount of water provided, the hours of sunlight each day, and the amount of fertilizer used.
The goal of multiple linear regression is to find an equation that most closely matches the historical data. “Multiple” indicates that you can use more than one independent variable to define the dependent variable in the regression equation. “Linear” indicates that the regression equation is a linear equation.
The linear equation describes how the independent variables (x1, x2, x3,...) combine to define the single dependent variable (y). Multiple linear regression finds the coefficients for the equation:
y = b0 + b1x1 + b2x2 + b3x3 + ... + e
where b1, b2, and b3, are the coefficients of the independent variables, b0 is the y-intercept constant, and e is the error.
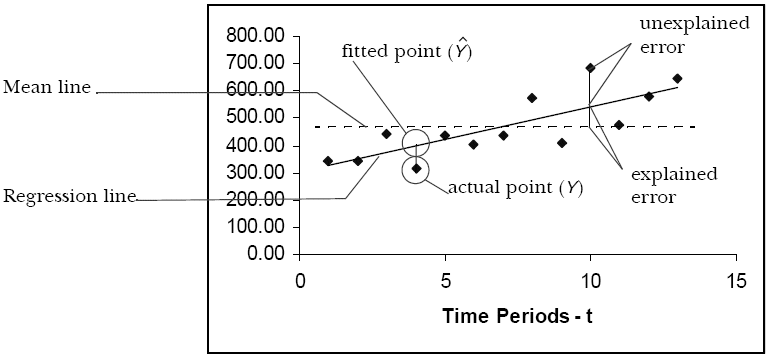
If there is only one independent variable, the equation defines a straight line. This uses a special case of multiple linear regression called simple linear regression, with the equation:
where b0 is where the regression line crosses the graph's y axis, x is the independent variable, and e is the error. When the regression equation has only two independent variables, it defines a plane. When the regression equation has more than two independent variables, it defines a hyperplane.
To find the coefficients of these equations, Predictor uses singular value decomposition. For more information on this technique, see the Oracle Crystal Ball Statistical Guide.
For more information on multiple linear regressions, see:
