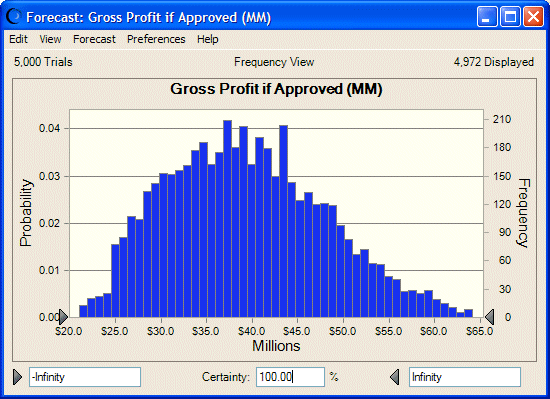
Forecast charts are the basic tool for Crystal Ball results analysis. They use frequency distributions to show the number of values occurring in a given interval. The result is a range of values representing possible and probable values for a given forecast formula based on input assumption definitions. You can use forecast charts to evaluate the certainty of obtaining a particular value or range of forecast values. For more information on forecast charts, see Analyzing Forecast Charts.
