Sensitivity charts have several limitations:
Correlated assumptions. Sensitivity calculations might be inaccurate for correlated assumptions. For example, if an important assumption were highly correlated with an unimportant one, the unimportant assumption would likely have a high sensitivity with respect to the target forecast. Assumptions that are correlated are flagged as such on the sensitivity chart. In some circumstances, turning off correlations in the Run Preferences dialog might help you to gain more accurate sensitivity information.
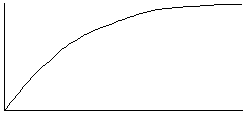
Non-monotonic relationships. Sensitivity calculations might be inaccurate for assumptions whose relationships with the target forecast are not monotonic. A monotonic relationship means that an increase in the assumption tends to be accompanied by a strict increase in the forecast; or an increase in the assumption tends to be accompanied by a strict decrease in the forecast.
For example, the relationship y = Log(x) is monotonic:
The Tornado Chart tool can help you discover if any of the assumptions have non-monotonic relationships with the target forecast. For more information, see Tornado Chart Tool.
Discrete distributions. Sensitivity calculations might be inaccurate for assumptions or forecasts that have a small set of discrete values. Because the sensitivity calculation relies on rank correlation, a slight loss of information occurs when the assumption or forecast values are replaced by ranks. This loss of information is generally offset by the advantage of being able to measure sensitivity between dissimilar types of distributions. However, when a large percentage of assumption or forecast values are similar or identical, this loss of information grows and can significantly distort the calculation of correlations.

