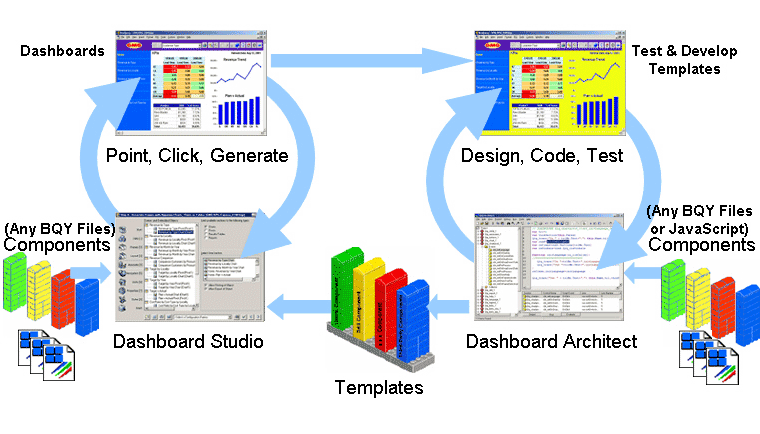
The figure illustrates the dashboard development environment and the role of Dashboard Architect within the test and development cycle.

The test and development cycle of Dashboard Studio templates is displayed on the right side of the diagram. Dashboard Architect provides a 4GL-programming environment that uses JavaScript and leverages the Interactive Reporting Studio object model. On the left side of the diagram, the platform provides a 5GL-development environment that requires no programming at all. Application development is through a template-driven, point-and-click wizard whose templates can be extended with plug-and-play components developed by using Dashboard Architect. See the Hyperion Interactive Reporting – Object Model and Dashboard Development Services Developer's Guide, Volume 7: Component Reference Guide.
Dashboard Studio templates contain frameworks that provide most basic functions required by analytical applications or dashboards. These functions are implemented as discrete components that are plugged together in a variety of combinations to form templates. Templates are transformed into sophisticated applications with Dashboard Studio, a point-and-click dashboard constructor.
The JavaScript at the core of these templates was developed initially with the Interactive Reporting Studio JavaScript editor. A more powerful development environment was required to cope with the size and complexity of the template, therefore Dashboard Architect was developed.
Dashboard Architect is a JavaScript editor and debugger that is integrated with Interactive Reporting Studio. Dashboard Architect is used to create and maintain Interactive Reporting Studio JavaScript applications, and coupled with Dashboard Studio, it provides a great productivity advantage to users.
The right side of the dashboard development environment diagram is optional, and applies only if Dashboard Architect is used to create templates. The left side of the diagram represents a lifecycle of developing applications directly.
The dashboard development environment is founded on these principles:
Users capable of surfing the web can use a dashboard
Users capable of building Interactive Reporting Studio charts or pivots can build sophisticated dashboards with a point-and-click paradigm
JavaScript programmers can build Interactive Reporting Studio applications and plug-and-play components in a productive manner using these facilities
Interactive Reporting Studio users can increase quality and productivity by reusing data and code sections