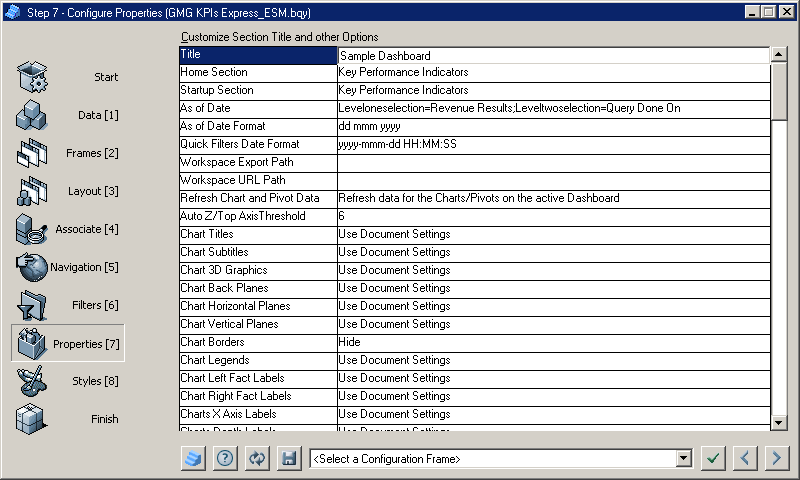
This step enables you to set dashboard properties. All properties are optional.

These are the main property areas that are available for configuration in the step.
Title—Enter a title, which is also the default file name for the dashboard (The title is displayed on the Home frame that is created from frame prototypes that support the Title property)
Home Section—Specify a Home frame for the dashboard (Available in only some frame prototypes. See Specifying a Home Section)
Startup Section—Specify the first frame that is displayed when the dashboard is opened (All available sections are listed, including frames not created with Dashboard Studio. The Filter Control EIS frame is available)
As of Date—Select a date column that must contain date as the data type (As of Date, identifies the timeliness of the dashboard data. See Defining the As of Date Column. If the column contains multiple values, the first date column value is selected)
As of Date Format—Specify the format in which the As of Date is displayed (Multiple formats are available)
Quick Filters Date Format—Specify the default format of the date filters in the dashboard (By default, date filters without formats assigned to them in QIQ Filter Properties use the yyyy-mmm-dd hh:mm:ss format. Date formats set in QIQ Filter Properties take precedence over this property. The default format is applied if an invalid date format is specified in this step or QIQ Filter Properties)
EPM Workspace Export Path—Specify the server location where files are saved when sections are exported (See EPM Workspace Export Path)
EPM Workspace URL Path—Specify the Web browsers path used to access exported files (See EPM Workspace URL Path)
Refresh Chart and Pivot Data—Set to control how charts and pivots are updated when filters are set or a query is reprocessed (Refresh all data simultaneously or when the data is moved to the frame. Select the Use Document Settings command if this property is not to be set by Dashboard Studio)
Auto Z/Top Axis Threshold—Set the threshold for the Auto Z/Top Axis feature that was applied in Step 4: Associate Frames with Charts, Pivots, or Tables (The default threshold is 4. If too many values are displayed, a chart or pivot is difficult to read)
Chart Settings—Set to manipulate the format and behavior of charts embedded within frames (Select the Use Document Settings command if chart options are not to be set by Dashboard Studio)
Toolbars, Menus, Status Bar, and Title Bar Settings—Set to display or hide toolbars, menus, the status bar, and the title bar in the plug-in and desktop editions of Interactive Reporting Studio (Select True for these properties to set the features to visible. Plug-in features apply in a Web browser or thin-client environment. LAN client features apply in a client environment. Only runtime dashboards are affected by these properties. ESM dashboards open with typical Interactive Reporting Studio settings)
 To configure properties:
In Step 7: Configure Properties, change one or more property settings.
An example is to change Chart Titles by removing object types. If a prefix is used to group multiple charts on a frame, changing the chart title removes the prefix. That is, if a chart is named Home..Total Sales chart, the title is changed to Total Sales.
Click
 to apply the selections to the document.
Click
 to move to the next step.
Step 8: Configure Style is displayed.