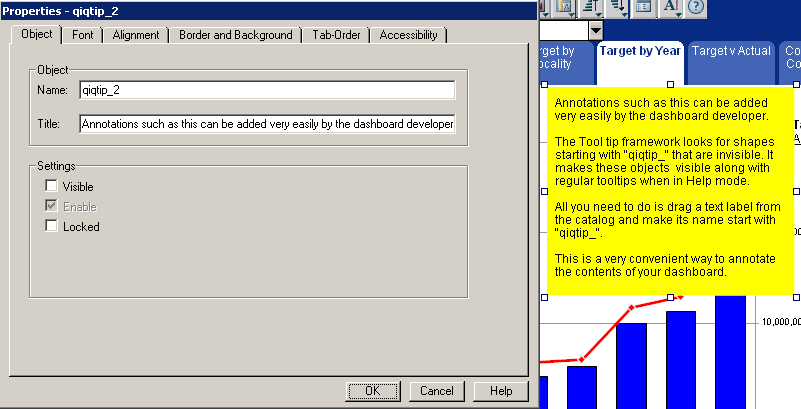
This procedure describes how to create and view annotations.
 To create and test annotations:
In Interactive Reporting Studio, press Ctrl+D to enter Design mode.
From the catalog pane, expand Graphics.
Drag a text label onto the frame, right-click the label, and select Properties.
In Name, enter qiqtip_<name>.
The name must begin with qiqtip_. For example, enter qiqtip_Limits.
In Title, enter the annotation.
Optional: Enter the annotation directly into the text label.
Clear Visible, and click OK.

Repeat steps 3–7 to insert other annotations.
Format the annotation.
Press Ctrl+D to exit Design mode, and click
 , on the dashboard top panel.
The position of the annotation is important. Text labels are visible if positioned in front of a view-only chart. However, text labels are typically situated behind pivots, drop-down lists, check boxes, and other active objects, so it is recommended that annotations are not positioned on top of these objects. This is a standard feature in Interactive Reporting Studio.
If a text label is positioned on top of a graphic that contains JavaScript, the graphic cannot be clicked and the code cannot be executed, even if the text label is not visible. This is a standard feature in Interactive Reporting Studio.